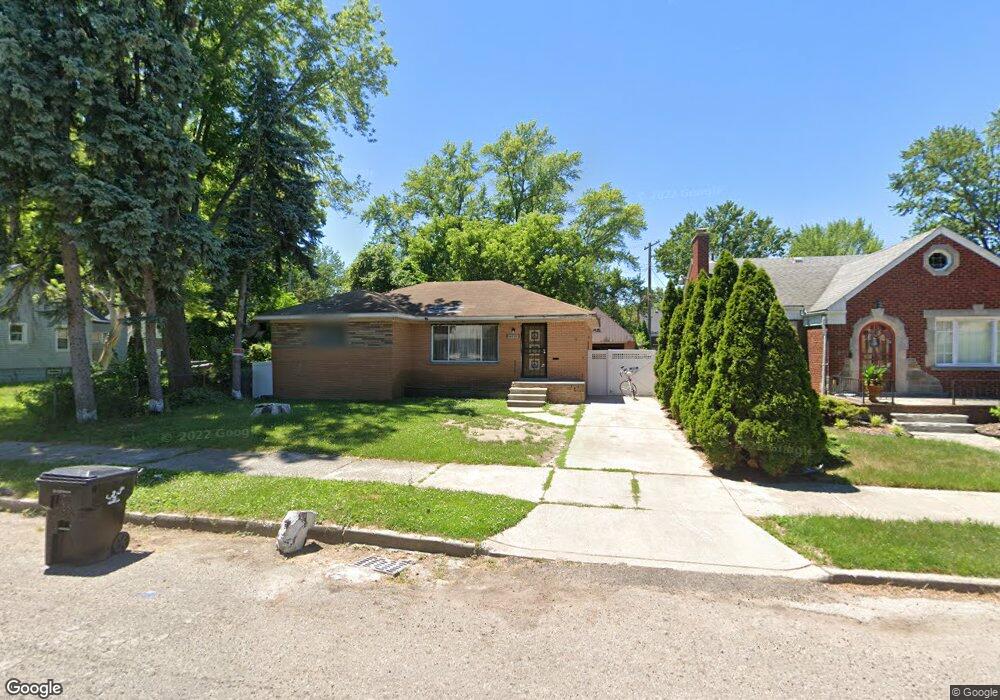
4619 Farmbrook St Detroit, MI 48224
Cornerstone Village NeighborhoodEstimated Value: $81,029 - $98,000
3
Beds
1
Bath
1,193
Sq Ft
$77/Sq Ft
Est. Value
About This Home
This home is located at 4619 Farmbrook St, Detroit, MI 48224 and is currently estimated at $91,507, approximately $76 per square foot. 4619 Farmbrook St is a home located in Wayne County with nearby schools including Marquette Elementary-Middle School, Edward 'Duke' Ellington Conservatory of Music and Art, and Charles L. Spain Elementary-Middle School.
Ownership History
Date
Name
Owned For
Owner Type
Purchase Details
Closed on
Dec 2, 2025
Sold by
Shaba Robert
Bought by
Shaba South Properties Llc
Current Estimated Value
Purchase Details
Closed on
Oct 16, 2025
Sold by
Wayne County Treasurer
Bought by
Shaba South Properties Llc and Shaba
Purchase Details
Closed on
Oct 9, 2013
Sold by
Strategic Advantage Llc
Bought by
Aaaq Global Investment & Consulting One
Purchase Details
Closed on
Jun 6, 2013
Sold by
Wayne County Treasurer
Bought by
Strategic Advantage Llc
Purchase Details
Closed on
Dec 6, 2012
Sold by
Wayne County Treasurer
Bought by
Green Clover Property Llc
Purchase Details
Closed on
Aug 15, 2008
Sold by
Ritts Nicholas
Bought by
Little M Investments Llc
Purchase Details
Closed on
Jun 11, 2008
Sold by
Us Bank Na
Bought by
Ritts Nicholas M
Purchase Details
Closed on
Oct 4, 2007
Sold by
Williams Jamie
Bought by
Us Bank Na and Mortgage Pass Through Certificates Serie
Purchase Details
Closed on
Dec 12, 2005
Sold by
Quinn Michael H and Quinn David J
Bought by
Williams Jamie
Create a Home Valuation Report for This Property
The Home Valuation Report is an in-depth analysis detailing your home's value as well as a comparison with similar homes in the area
Home Values in the Area
Average Home Value in this Area
Purchase History
| Date | Buyer | Sale Price | Title Company |
|---|---|---|---|
| Shaba South Properties Llc | -- | None Listed On Document | |
| Shaba South Properties Llc | $24,002 | None Listed On Document | |
| Aaaq Global Investment & Consulting One | -- | None Available | |
| Strategic Advantage Llc | $500 | None Available | |
| Green Clover Property Llc | $500 | None Available | |
| Little M Investments Llc | $10,000 | Abstract Title Agency | |
| Ritts Nicholas M | $5,600 | Attorneys Title | |
| Us Bank Na | $78,699 | None Available | |
| Williams Jamie | $89,000 | Greco |
Source: Public Records
Tax History
| Year | Tax Paid | Tax Assessment Tax Assessment Total Assessment is a certain percentage of the fair market value that is determined by local assessors to be the total taxable value of land and additions on the property. | Land | Improvement |
|---|---|---|---|---|
| 2025 | $1,147 | $30,300 | $0 | $0 |
| 2024 | $1,130 | $25,900 | $0 | $0 |
| 2023 | $1,097 | $19,300 | $0 | $0 |
| 2022 | $1,166 | $19,200 | $0 | $0 |
| 2021 | $1,136 | $15,100 | $0 | $0 |
| 2020 | $1,136 | $13,500 | $0 | $0 |
| 2019 | $1,119 | $11,400 | $0 | $0 |
| 2018 | $987 | $9,700 | $0 | $0 |
| 2017 | $188 | $9,900 | $0 | $0 |
| 2016 | $1,437 | $900 | $0 | $0 |
| 2015 | $90 | $900 | $0 | $0 |
| 2013 | $2,155 | $21,553 | $0 | $0 |
| 2010 | -- | $31,599 | $885 | $30,714 |
Source: Public Records
Map
Nearby Homes
- 4598 Lodewyck St
- 4607 Radnor St
- 4861 Farmbrook St
- 18101 Cornwall St
- 4528 Farmbrook St
- 18109 Cornwall St
- 18119 Cornwall St
- 4880 Lodewyck St
- 4496 Radnor St
- 4865 Marseilles St
- 4845 University Place
- 4522 Hereford St
- 5210 Farmbrook St
- 4705 Neff Ave
- 5154 Hereford St
- 5220 University Place
- 5232 University Place
- 4082 Hereford St
- 4383 Neff Ave
- 5047 Anatole St
- 4619 Farmbook
- 4627 Farmbrook St
- 4607 Farmbrook St
- 4601 Farmbrook St
- 4616 Lodewyck St
- 4606 Lodewyck St
- 4626 Lodewyck St
- 4589 Farmbrook St
- 4606 Farmbrook St
- 4626 Farmbrook St
- 4586 Lodewyck St
- 4804 Lodewyck St
- 4598 Farmbrook St
- 4577 Farmbrook St
- 4815 Farmbrook St
- 4815 Farmbrook St
- 4601 Radnor St
- 4586 Farmbrook St
- 4586 Farmbrook St
- 4576 Lodewyck St
Your Personal Tour Guide
Ask me questions while you tour the home.