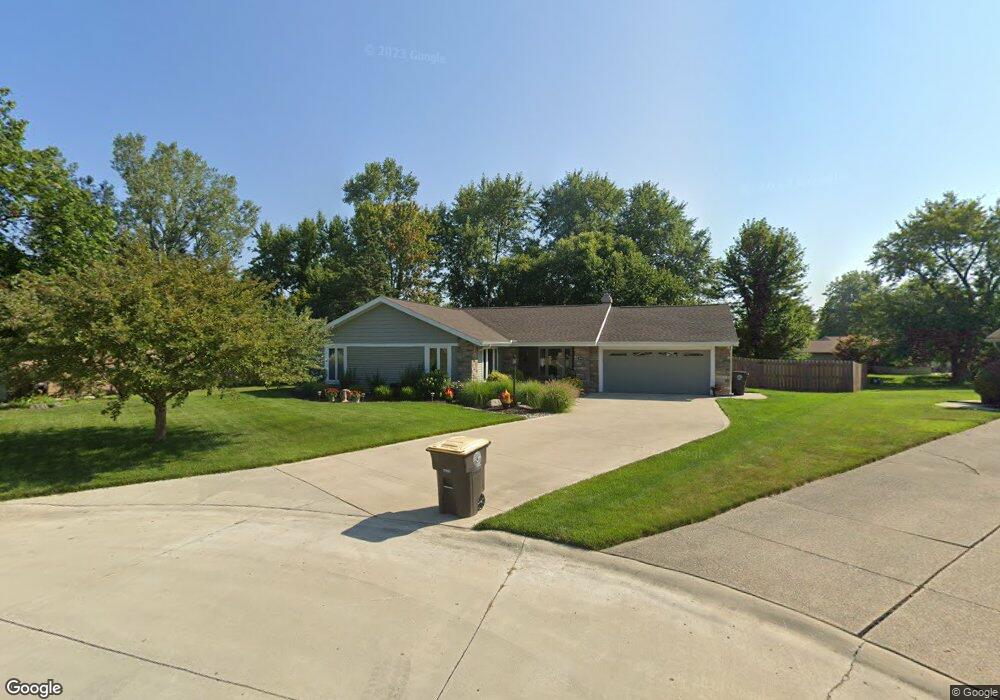
4619 Gray Owl Place Fort Wayne, IN 46804
Aboite NeighborhoodEstimated Value: $248,000 - $265,000
4
Beds
3
Baths
1,680
Sq Ft
$154/Sq Ft
Est. Value
About This Home
This home is located at 4619 Gray Owl Place, Fort Wayne, IN 46804 and is currently estimated at $258,247, approximately $153 per square foot. 4619 Gray Owl Place is a home located in Allen County with nearby schools including Haverhill Elementary School, Summit Middle School, and Homestead Senior High School.
Ownership History
Date
Name
Owned For
Owner Type
Purchase Details
Closed on
Mar 1, 2010
Sold by
Leonard Cynthia R
Bought by
Lothamer John L and Lothamer Barbara S
Current Estimated Value
Home Financials for this Owner
Home Financials are based on the most recent Mortgage that was taken out on this home.
Original Mortgage
$122,823
Interest Rate
5.02%
Mortgage Type
VA
Purchase Details
Closed on
Jun 28, 2004
Sold by
Mershon Randy L and Mershon Brenda Sue
Bought by
Leonard Cynthia R
Home Financials for this Owner
Home Financials are based on the most recent Mortgage that was taken out on this home.
Original Mortgage
$95,400
Interest Rate
6.37%
Mortgage Type
Purchase Money Mortgage
Purchase Details
Closed on
Jan 24, 2003
Sold by
Mershon Randy and Mershon Brenda
Bought by
Leonard Cynthia
Home Financials for this Owner
Home Financials are based on the most recent Mortgage that was taken out on this home.
Original Mortgage
$90,000
Interest Rate
8%
Mortgage Type
Seller Take Back
Create a Home Valuation Report for This Property
The Home Valuation Report is an in-depth analysis detailing your home's value as well as a comparison with similar homes in the area
Home Values in the Area
Average Home Value in this Area
Purchase History
| Date | Buyer | Sale Price | Title Company |
|---|---|---|---|
| Lothamer John L | -- | Metropolitan Title Of In | |
| Leonard Cynthia R | -- | -- | |
| Leonard Cynthia | $98,000 | Three Rivers Title Company I |
Source: Public Records
Mortgage History
| Date | Status | Borrower | Loan Amount |
|---|---|---|---|
| Closed | Lothamer John L | $122,823 | |
| Previous Owner | Leonard Cynthia R | $95,400 | |
| Previous Owner | Leonard Cynthia | $90,000 |
Source: Public Records
Tax History Compared to Growth
Tax History
| Year | Tax Paid | Tax Assessment Tax Assessment Total Assessment is a certain percentage of the fair market value that is determined by local assessors to be the total taxable value of land and additions on the property. | Land | Improvement |
|---|---|---|---|---|
| 2024 | $2,102 | $214,700 | $45,400 | $169,300 |
| 2022 | $1,961 | $183,100 | $26,900 | $156,200 |
| 2021 | $1,685 | $161,700 | $26,900 | $134,800 |
| 2020 | $1,592 | $147,900 | $26,900 | $121,000 |
| 2019 | $1,502 | $139,100 | $26,900 | $112,200 |
| 2018 | $1,414 | $130,600 | $26,900 | $103,700 |
| 2017 | $1,193 | $113,500 | $26,900 | $86,600 |
| 2016 | $1,180 | $111,600 | $26,900 | $84,700 |
| 2014 | $1,148 | $110,400 | $26,900 | $83,500 |
| 2013 | $1,106 | $107,200 | $26,900 | $80,300 |
Source: Public Records
Map
Nearby Homes
- 9324 Saratoga Rd
- 9420 Saratoga Rd
- 4011 Thornbury Place
- 3901 Ravenscliff Place
- 5164 Coventry Ln
- 5140 Coventry Ln
- 4224 Live Oak Blvd
- 3806 Pebblewood Place
- 9916 Quachita Ct
- 9928 Berkshire Ln
- 3516 Stone Creek Run
- 10424 Paw Dr
- 9012 Stockbridge Place
- 8934 Stockbridge Place
- 3209 Covington Reserve Pkwy
- 8929 Dunmore Ln
- 5818 Chase Creek Ct
- 9204 Barbara Ln
- 5916 Chase Creek Ct
- 3910 Dicke Rd
- 4611 Gray Owl Place
- 4627 Gray Owl Place
- 9319 Crystal Spring Dr
- 4429 Gray Owl Place
- 9325 Crystal Spring Dr
- 9307 Crystal Spring Dr
- 4618 Gray Owl Place
- 4626 Gray Owl Place
- 9313 Crystal Spring Dr
- 4610 Gray Owl Place
- 4421 Gray Owl Place
- 9324 Crystal Spring Dr
- 9231 Crystal Spring Dr
- 4430 Gray Owl Place
- 4420 Gray Owl Place
- 9316 Crystal Spring Dr
- 9322 Crystal Spring Dr
- 9318 Thunder Hill Place
- 9312 Thunder Hill Place
- 9302 Crystal Spring Dr