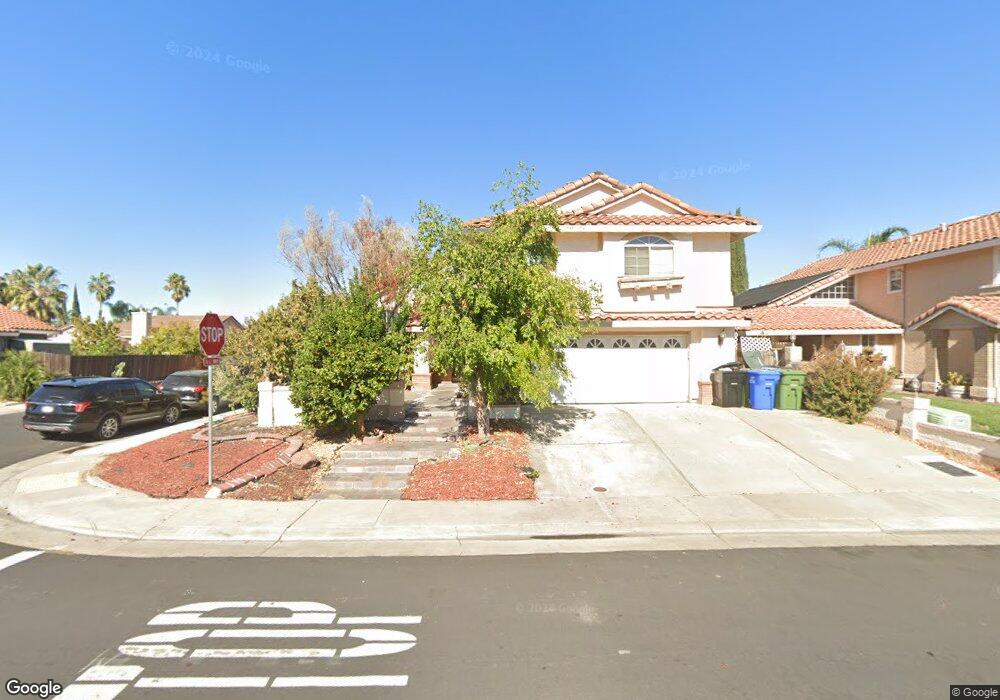
4619 Laguna West Way Elk Grove, CA 95758
North West Elk Grove NeighborhoodEstimated Value: $495,000 - $603,000
3
Beds
3
Baths
2,164
Sq Ft
$261/Sq Ft
Est. Value
About This Home
This home is located at 4619 Laguna West Way, Elk Grove, CA 95758 and is currently estimated at $564,201, approximately $260 per square foot. 4619 Laguna West Way is a home located in Sacramento County with nearby schools including Marion Mix Elementary School, Harriet G. Eddy Middle School, and Laguna Creek High School.
Ownership History
Date
Name
Owned For
Owner Type
Purchase Details
Closed on
May 5, 2018
Sold by
Nguyen Phi Vu Chuc and Thai Tai Thi
Bought by
Nguyen Phi Vu Chuc and Thai Tai Thi
Current Estimated Value
Purchase Details
Closed on
Aug 17, 2000
Sold by
Yu Kenneth K and Yu Maureen S
Bought by
Freeman Bernice O
Home Financials for this Owner
Home Financials are based on the most recent Mortgage that was taken out on this home.
Original Mortgage
$132,000
Outstanding Balance
$47,625
Interest Rate
8.15%
Estimated Equity
$516,576
Purchase Details
Closed on
Jan 30, 1996
Sold by
Nguyen Thuy Thi
Bought by
Nguyen Phi Vu and Thai Tai Thi
Home Financials for this Owner
Home Financials are based on the most recent Mortgage that was taken out on this home.
Original Mortgage
$120,000
Interest Rate
7.25%
Purchase Details
Closed on
Mar 10, 1994
Sold by
Nguyen Trinh
Bought by
Nguyen Thuy Thi
Create a Home Valuation Report for This Property
The Home Valuation Report is an in-depth analysis detailing your home's value as well as a comparison with similar homes in the area
Home Values in the Area
Average Home Value in this Area
Purchase History
| Date | Buyer | Sale Price | Title Company |
|---|---|---|---|
| Nguyen Phi Vu Chuc | -- | None Available | |
| Freeman Bernice O | $165,000 | Fidelity National Title Co | |
| Nguyen Phi Vu | $150,000 | Chicago Title Co | |
| Nguyen Thuy Thi | -- | Chicago Title Co | |
| Nguyen Thuy Thi | -- | -- |
Source: Public Records
Mortgage History
| Date | Status | Borrower | Loan Amount |
|---|---|---|---|
| Open | Freeman Bernice O | $132,000 | |
| Previous Owner | Nguyen Thuy Thi | $120,000 |
Source: Public Records
Tax History Compared to Growth
Tax History
| Year | Tax Paid | Tax Assessment Tax Assessment Total Assessment is a certain percentage of the fair market value that is determined by local assessors to be the total taxable value of land and additions on the property. | Land | Improvement |
|---|---|---|---|---|
| 2025 | $3,087 | $249,323 | $66,433 | $182,890 |
| 2024 | $3,087 | $244,435 | $65,131 | $179,304 |
| 2023 | $3,001 | $239,643 | $63,854 | $175,789 |
| 2022 | $2,953 | $234,945 | $62,602 | $172,343 |
| 2021 | $2,892 | $230,339 | $61,375 | $168,964 |
| 2020 | $2,849 | $227,978 | $60,746 | $167,232 |
| 2019 | $2,795 | $223,508 | $59,555 | $163,953 |
| 2018 | $2,721 | $219,127 | $58,388 | $160,739 |
| 2017 | $2,668 | $214,832 | $57,244 | $157,588 |
| 2016 | $2,479 | $210,621 | $56,122 | $154,499 |
| 2015 | $2,429 | $207,458 | $55,279 | $152,179 |
| 2014 | $2,397 | $203,396 | $54,197 | $149,199 |
Source: Public Records
Map
Nearby Homes
- 4521 Freitag Way
- 5013 Efthemia Way
- 9144 Hensley Way
- 5208 Misty Meadow Way
- Residence 2125 Plan at Tegan Estates
- Residence 1845 Plan at Tegan Estates
- Residence 1960 Plan at Tegan Estates
- Residence 1850 Plan at Tegan Estates
- 9121 Hensley Way
- 9139 Hensley Way
- 8959 Boreal Way
- 5129 Tegan Rd
- 8944 Warmsprings St
- 9186 Jamel Ct
- 5201 Laguna Oaks Dr Unit 96
- 5201 Laguna Oaks Dr Unit 12
- 5201 Laguna Oaks Dr Unit 70
- 5201 Laguna Oaks Dr
- 9313 Edisto Way
- 5407 Coral Creek Way
- 4623 Laguna Way W
- 4623 Laguna West Way
- 9036 Stinson Beach Way
- 4701 Laguna Way W
- 4701 Laguna West Way
- 4609 Laguna West Way
- 4609 Laguna Way W
- 9040 Stinson Beach Way
- 9111 Newport West Way
- 9026 Stinson Beach Way
- 4705 Laguna Way W
- 4705 Laguna West Way
- 9044 Stinson Beach Way
- 4605 Laguna West Way
- 4610 Laguna West Way
- 4700 Laguna West Way
- 9115 Newport West Way
- 9022 Stinson Beach Way
- 4709 Laguna West Way
- 4606 Laguna West Way