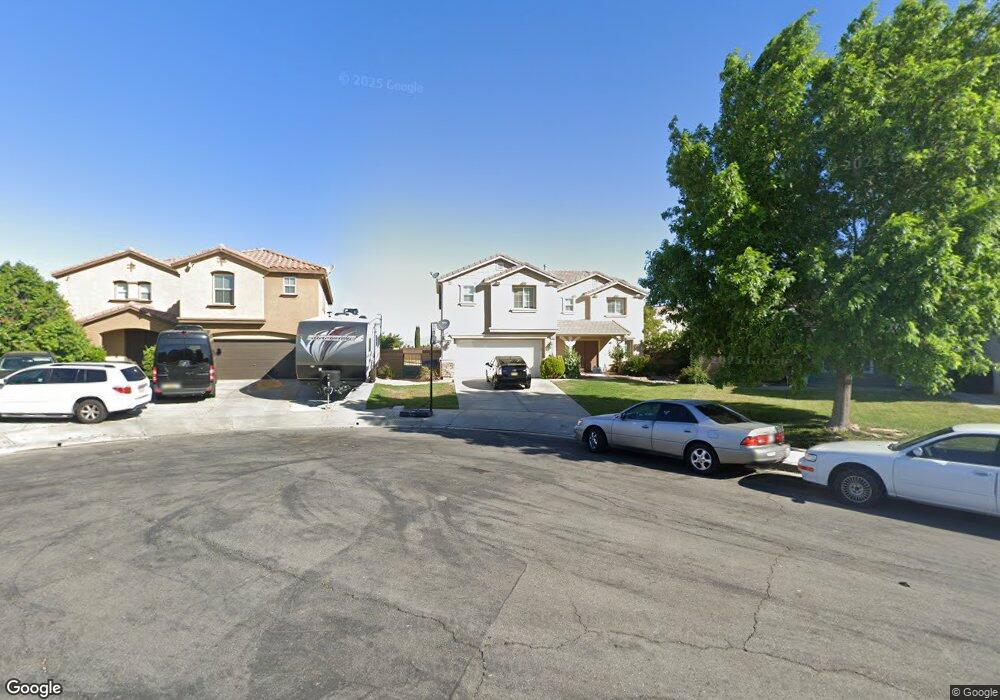
4619 Parton Ct Lancaster, CA 93536
West Lancaster NeighborhoodEstimated Value: $617,728 - $692,000
3
Beds
3
Baths
3,992
Sq Ft
$164/Sq Ft
Est. Value
About This Home
This home is located at 4619 Parton Ct, Lancaster, CA 93536 and is currently estimated at $654,182, approximately $163 per square foot. 4619 Parton Ct is a home located in Los Angeles County with nearby schools including Nancy Cory Elementary School, Endeavour Middle School, and Lancaster High School.
Ownership History
Date
Name
Owned For
Owner Type
Purchase Details
Closed on
Feb 11, 2009
Sold by
Lin Chang Hsiao
Bought by
Lin Bou Zu
Current Estimated Value
Purchase Details
Closed on
Feb 5, 2009
Sold by
Us Bank National Association
Bought by
Lin Bou Zu and Lin Yingkai
Purchase Details
Closed on
May 7, 2008
Sold by
Gray Tiffany
Bought by
Us Bank Na and Securitized Asset Backed Receivables Llc
Purchase Details
Closed on
Aug 31, 2005
Sold by
Fontenot Keon
Bought by
Gray Tiffany
Home Financials for this Owner
Home Financials are based on the most recent Mortgage that was taken out on this home.
Original Mortgage
$111,200
Interest Rate
5.72%
Mortgage Type
Stand Alone Second
Purchase Details
Closed on
Mar 28, 2005
Sold by
Kb Home Greater Los Angeles Inc
Bought by
Gray Tiffany
Home Financials for this Owner
Home Financials are based on the most recent Mortgage that was taken out on this home.
Original Mortgage
$444,800
Interest Rate
5.75%
Mortgage Type
Fannie Mae Freddie Mac
Create a Home Valuation Report for This Property
The Home Valuation Report is an in-depth analysis detailing your home's value as well as a comparison with similar homes in the area
Home Values in the Area
Average Home Value in this Area
Purchase History
| Date | Buyer | Sale Price | Title Company |
|---|---|---|---|
| Lin Bou Zu | -- | California Title Company | |
| Lin Bou Zu | $261,000 | California Title Company | |
| Us Bank Na | $441,150 | Accommodation | |
| Gray Tiffany | -- | First American Title Co | |
| Gray Tiffany | $557,000 | First American Title Co |
Source: Public Records
Mortgage History
| Date | Status | Borrower | Loan Amount |
|---|---|---|---|
| Previous Owner | Gray Tiffany | $111,200 | |
| Previous Owner | Gray Tiffany | $444,800 |
Source: Public Records
Tax History
| Year | Tax Paid | Tax Assessment Tax Assessment Total Assessment is a certain percentage of the fair market value that is determined by local assessors to be the total taxable value of land and additions on the property. | Land | Improvement |
|---|---|---|---|---|
| 2025 | $5,634 | $336,090 | $67,212 | $268,878 |
| 2024 | $5,634 | $329,501 | $65,895 | $263,606 |
| 2023 | $5,520 | $323,041 | $64,603 | $258,438 |
| 2022 | $5,289 | $316,708 | $63,337 | $253,371 |
| 2021 | $4,860 | $310,499 | $62,096 | $248,403 |
| 2019 | $4,721 | $301,291 | $60,255 | $241,036 |
| 2018 | $4,639 | $295,384 | $59,074 | $236,310 |
| 2016 | $4,368 | $283,916 | $56,781 | $227,135 |
| 2015 | $4,312 | $279,653 | $55,929 | $223,724 |
| 2014 | $4,268 | $274,176 | $54,834 | $219,342 |
Source: Public Records
Map
Nearby Homes
- 4614 Stillmeadow Ln
- 43353 Honeybee Ln
- 43521 Blossom Dr
- 0 47th Stw Vic Ave K2 Unit 26001095
- 43323 Honeybee Ln
- 4660 Spice St
- 43334 Shady Hollow Ln
- 43704 47th St W
- 43435 50th St W
- 43168 45th St W
- 4258 W Avenue k8
- 0 Cor Avenue K4 and 42nd Stw Unit 25004028
- 4710 W Avenue k10
- 0 Vic Avenue 51st Stw K
- 4621 W Avenue k12
- 43834 Firewood Way
- 43864 Firewood Way
- 43890 Moccasin Place
- 43929 44th St W
- 43948 Spring St
- 4621 Parton Ct
- 4615 Parton Ct
- 4618 Brentwood Ct
- 4612 Brentwood Ct
- 4622 Brentwood Ct
- 4622 Parton Ct
- 4613 Parton Ct
- 4606 Brentwood Ct
- 4618 Parton Ct
- 4612 Parton Ct
- 4621 Brentwood Ct
- 4559 Parton Ct
- 4606 Parton Ct
- 4558 Brentwood Ct
- 43360 Windrose Ln
- 4619 Brentwood Ct
- 4551 Parton Ct
- 4615 Brentwood Ct
- 43361 46th St W
- 4609 Brentwood Ct
Your Personal Tour Guide
Ask me questions while you tour the home.