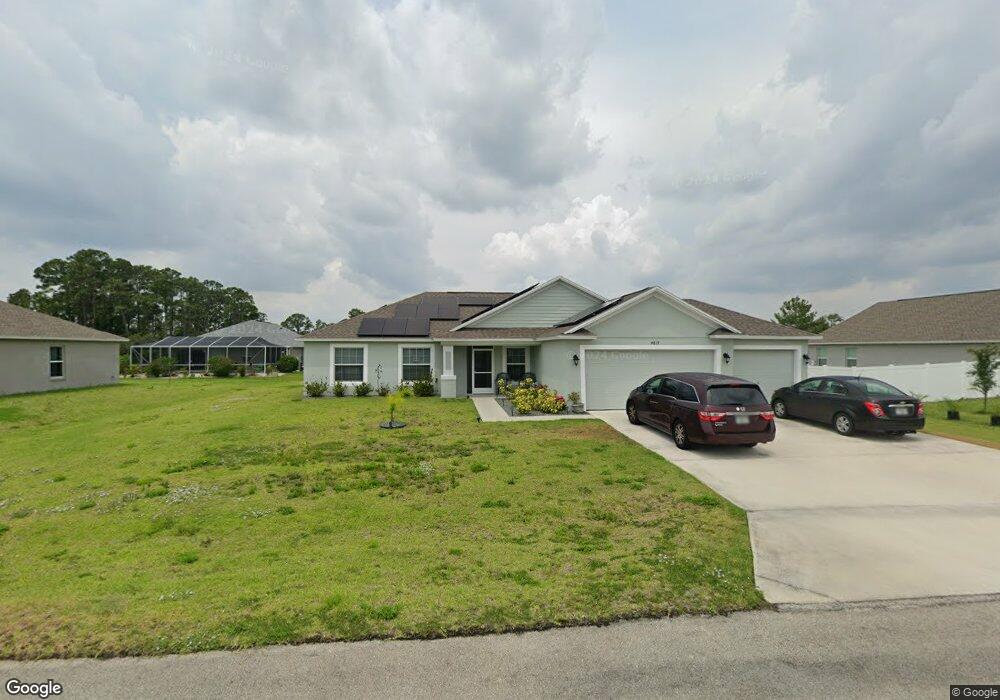
4619 San Ignacio Dr Sebring, FL 33872
Sun N Lake NeighborhoodEstimated Value: $338,629 - $381,000
3
Beds
2
Baths
1,916
Sq Ft
$184/Sq Ft
Est. Value
About This Home
This home is located at 4619 San Ignacio Dr, Sebring, FL 33872 and is currently estimated at $353,407, approximately $184 per square foot. 4619 San Ignacio Dr is a home with nearby schools including Sun 'N Lake Elementary School, Avon Park High School, and Hill-Gustat Middle School.
Ownership History
Date
Name
Owned For
Owner Type
Purchase Details
Closed on
Oct 9, 2024
Sold by
Summit Homes Holdings Llc
Bought by
Summit Homes Development Llc
Current Estimated Value
Purchase Details
Closed on
May 5, 2021
Sold by
Ge Investments Of Polk Llc
Bought by
Spack Angela Dickerman and Spack William Harold
Home Financials for this Owner
Home Financials are based on the most recent Mortgage that was taken out on this home.
Original Mortgage
$223,250
Interest Rate
3.1%
Mortgage Type
Construction
Purchase Details
Closed on
Oct 6, 2020
Sold by
Highlands County
Bought by
Ge Investments Of Polk Llc
Purchase Details
Closed on
Feb 11, 2019
Sold by
County Of Highlands
Bought by
Board Of County Commissioners
Purchase Details
Closed on
Jul 12, 2005
Sold by
Cfd Inc
Bought by
Moore Mildred
Create a Home Valuation Report for This Property
The Home Valuation Report is an in-depth analysis detailing your home's value as well as a comparison with similar homes in the area
Home Values in the Area
Average Home Value in this Area
Purchase History
| Date | Buyer | Sale Price | Title Company |
|---|---|---|---|
| Summit Homes Development Llc | $100 | None Listed On Document | |
| Spack Angela Dickerman | $22,000 | New Title Company Name | |
| Ge Investments Of Polk Llc | $9,500 | None Available | |
| Board Of County Commissioners | -- | None Available | |
| Moore Mildred | $1,200 | -- |
Source: Public Records
Mortgage History
| Date | Status | Borrower | Loan Amount |
|---|---|---|---|
| Previous Owner | Spack Angela Dickerman | $223,250 |
Source: Public Records
Tax History
| Year | Tax Paid | Tax Assessment Tax Assessment Total Assessment is a certain percentage of the fair market value that is determined by local assessors to be the total taxable value of land and additions on the property. | Land | Improvement |
|---|---|---|---|---|
| 2025 | $4,300 | $289,869 | $27,500 | $262,369 |
| 2024 | $4,111 | $298,992 | $26,000 | $272,992 |
| 2023 | $4,111 | $267,936 | $0 | $0 |
| 2022 | $3,576 | $231,956 | $10,000 | $221,956 |
| 2021 | $382 | $10,000 | $10,000 | $0 |
| 2020 | $0 | $10,000 | $0 | $0 |
| 2019 | $174 | $10,000 | $0 | $0 |
| 2018 | $174 | $10,000 | $0 | $0 |
| 2017 | $159 | $10,000 | $0 | $0 |
| 2016 | $163 | $10,000 | $0 | $0 |
| 2015 | $166 | $10,000 | $0 | $0 |
| 2014 | $199 | $0 | $0 | $0 |
Source: Public Records
Map
Nearby Homes
- 4559 San Ignacio Dr
- 4555 Myrtle Beach Dr
- 4600 San Lorenzo Dr
- 4825 San Lorenzo Dr
- 4661 San Lorenzo Dr
- 4569 San Lorenzo Dr
- 4640 San Lorenzo Dr
- 4640 San Lorenzo Dr Unit 16
- 4542 San Lorenzo Dr
- 4538 Myrtle Beach Dr
- 4644 San Ignacio Dr
- 4639 Myrtle Beach Dr
- 4600 Mignon Dr
- 4967 San Ignacio Dr
- 4658 Mignon Dr
- 4631 San Lorenzo Dr
- 4662 San Ignacio Dr
- 5008 San Ignacio Dr
- 4800 San Lorenzo Dr
- 4939 Pebble Beach Dr
- 4611 San Ignacio Dr
- 4625 San Ignacio Dr
- 4865 San Ignacio Dr
- 4512 San Ignacio Dr
- 5048 San Ignacio Dr
- 4975 San Ignacio Dr
- 4601 San Ignacio Dr
- 4554 San Lorenzo Dr
- 4566 San Lorenzo Dr
- 4618 San Ignacio Dr
- 4610 San Ignacio Dr
- 4548 San Lorenzo Dr
- 4600 San Ignacio Dr
- 4641 San Ignacio Dr
- 4937 San Lorenzo Dr
- 4613 Myrtle Beach Dr
- 4605 Myrtle Beach Dr
- 4621 Myrtle Beach Dr
Your Personal Tour Guide
Ask me questions while you tour the home.