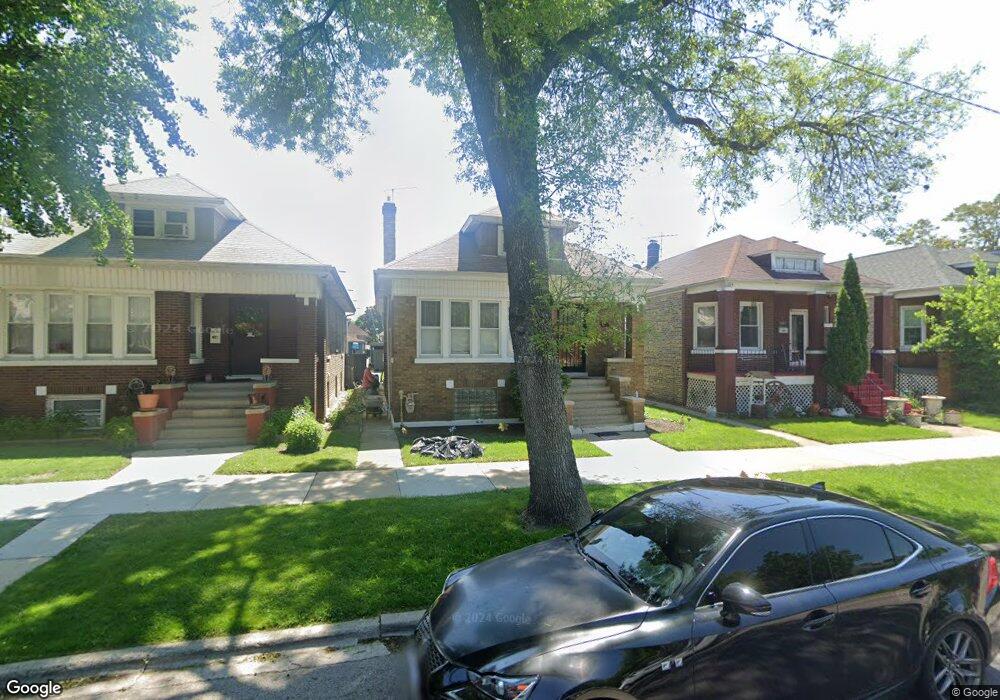
4619 W Shakespeare Ave Chicago, IL 60639
Hermosa NeighborhoodEstimated Value: $336,000 - $513,000
4
Beds
2
Baths
1,473
Sq Ft
$277/Sq Ft
Est. Value
About This Home
This home is located at 4619 W Shakespeare Ave, Chicago, IL 60639 and is currently estimated at $407,290, approximately $276 per square foot. 4619 W Shakespeare Ave is a home located in Cook County with nearby schools including Lloyd Elementary School, Northwest Middle School, and Foreman College and Career Academy.
Ownership History
Date
Name
Owned For
Owner Type
Purchase Details
Closed on
May 4, 1999
Sold by
Quiles Myrna D and Borrero Auria
Bought by
Leon Roberto L and Quiles Lydia
Current Estimated Value
Home Financials for this Owner
Home Financials are based on the most recent Mortgage that was taken out on this home.
Original Mortgage
$128,000
Outstanding Balance
$33,100
Interest Rate
7.05%
Estimated Equity
$374,190
Purchase Details
Closed on
Mar 17, 1999
Sold by
Quiles Myrna D and Borrero Auria
Bought by
Leon Roberto L and Quiles Lydia
Home Financials for this Owner
Home Financials are based on the most recent Mortgage that was taken out on this home.
Original Mortgage
$128,000
Outstanding Balance
$33,100
Interest Rate
7.05%
Estimated Equity
$374,190
Purchase Details
Closed on
Oct 1, 1996
Sold by
Lopez George L and Lopez Rosita
Bought by
Leon Roberto L and Borrero Auria
Home Financials for this Owner
Home Financials are based on the most recent Mortgage that was taken out on this home.
Original Mortgage
$126,636
Interest Rate
8%
Mortgage Type
FHA
Create a Home Valuation Report for This Property
The Home Valuation Report is an in-depth analysis detailing your home's value as well as a comparison with similar homes in the area
Home Values in the Area
Average Home Value in this Area
Purchase History
| Date | Buyer | Sale Price | Title Company |
|---|---|---|---|
| Leon Roberto L | -- | -- | |
| Leon Roberto L | -- | -- | |
| Leon Roberto L | $127,000 | Attorneys Natl Title Network |
Source: Public Records
Mortgage History
| Date | Status | Borrower | Loan Amount |
|---|---|---|---|
| Open | Leon Roberto L | $128,000 | |
| Closed | Leon Roberto L | $126,636 |
Source: Public Records
Tax History Compared to Growth
Tax History
| Year | Tax Paid | Tax Assessment Tax Assessment Total Assessment is a certain percentage of the fair market value that is determined by local assessors to be the total taxable value of land and additions on the property. | Land | Improvement |
|---|---|---|---|---|
| 2024 | $3,733 | $31,000 | $14,452 | $16,548 |
| 2023 | $3,618 | $21,000 | $10,835 | $10,165 |
| 2022 | $3,618 | $21,000 | $10,835 | $10,165 |
| 2021 | $3,555 | $20,999 | $10,835 | $10,164 |
| 2020 | $4,279 | $22,299 | $5,663 | $16,636 |
| 2019 | $4,348 | $25,056 | $5,663 | $19,393 |
| 2018 | $4,273 | $25,056 | $5,663 | $19,393 |
| 2017 | $4,185 | $22,807 | $5,077 | $17,730 |
| 2016 | $4,070 | $22,807 | $5,077 | $17,730 |
| 2015 | $3,701 | $22,807 | $5,077 | $17,730 |
| 2014 | $3,706 | $22,530 | $4,687 | $17,843 |
| 2013 | $3,622 | $22,530 | $4,687 | $17,843 |
Source: Public Records
Map
Nearby Homes
- 4637 W Mclean Ave
- 2016 N Kilbourn Ave
- 2035 N Cicero Ave
- 1930 N Kenneth Ave
- 2323 N Keating Ave
- 1943 N La Crosse Ave
- 2323 N Kilbourn Ave
- 4311 W Palmer St
- 1916 N Lowell Ave
- 1912 N Lowell Ave
- 4639 W Montana St
- 2050 N Laporte Ave
- 2420 N Kilbourn Ave
- 4624 W Montana St
- 4630 W Montana St
- 1748 N Keating Ave
- 4420 W Montana St
- 2218 N Lavergne Ave
- 2225 N Tripp Ave
- 2134 N Keeler Ave
- 4617 W Shakespeare Ave
- 4623 W Shakespeare Ave
- 4613 W Shakespeare Ave
- 4625 W Shakespeare Ave
- 4609 W Shakespeare Ave
- 4629 W Shakespeare Ave
- 4631 W Shakespeare Ave
- 4607 W Shakespeare Ave
- 4618 W Dickens Ave
- 4622 W Dickens Ave
- 4614 W Dickens Ave
- 4635 W Shakespeare Ave
- 4624 W Dickens Ave
- 4612 W Dickens Ave
- 4603 W Shakespeare Ave
- 4628 W Dickens Ave
- 4608 W Dickens Ave
- 4637 W Shakespeare Ave
- 4630 W Dickens Ave
- 4606 W Dickens Ave