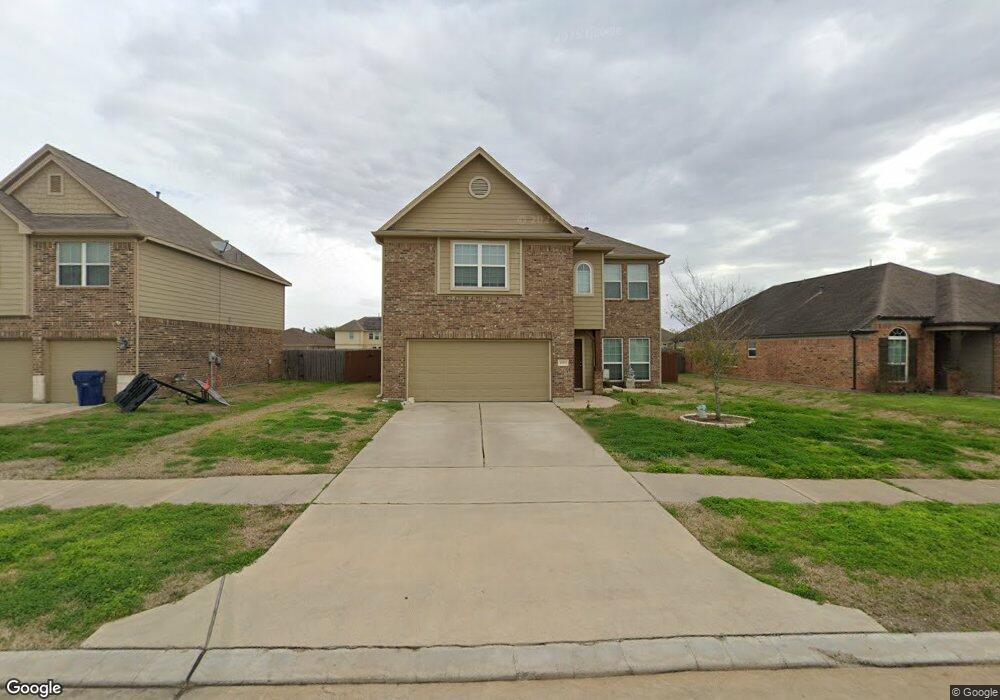
4619 Wheelwright Trail Rosenberg, TX 77471
Estimated Value: $282,755 - $307,000
4
Beds
3
Baths
1,975
Sq Ft
$149/Sq Ft
Est. Value
About This Home
This home is located at 4619 Wheelwright Trail, Rosenberg, TX 77471 and is currently estimated at $295,189, approximately $149 per square foot. 4619 Wheelwright Trail is a home located in Fort Bend County with nearby schools including Thomas R. Culver Elementary School and Harry Wright Junior High School.
Ownership History
Date
Name
Owned For
Owner Type
Purchase Details
Closed on
Jun 23, 2025
Sold by
Hernandez Rafael
Bought by
Mendoza Roberta
Current Estimated Value
Purchase Details
Closed on
Oct 8, 2023
Sold by
Hernandez Rafael
Bought by
Mendoza Roberta and Mendoza Jose Luis
Purchase Details
Closed on
Sep 14, 2016
Sold by
Long Lake Ltd
Bought by
Gateway Mortgage Group Llc
Home Financials for this Owner
Home Financials are based on the most recent Mortgage that was taken out on this home.
Original Mortgage
$175,035
Interest Rate
3.87%
Mortgage Type
FHA
Purchase Details
Closed on
Jun 1, 2016
Sold by
Woodmere Development Co Ltd
Bought by
Hernandez Rafael
Purchase Details
Closed on
Nov 4, 2014
Sold by
Woodmere Development Co Ltd
Bought by
Hernandez Rafael
Create a Home Valuation Report for This Property
The Home Valuation Report is an in-depth analysis detailing your home's value as well as a comparison with similar homes in the area
Home Values in the Area
Average Home Value in this Area
Purchase History
| Date | Buyer | Sale Price | Title Company |
|---|---|---|---|
| Mendoza Roberta | -- | None Listed On Document | |
| Mendoza Roberta | -- | None Listed On Document | |
| Gateway Mortgage Group Llc | -- | South Land Title Llc | |
| Hernandez Rafael | -- | -- | |
| Hernandez Rafael | -- | -- | |
| Hernandez Rafael | -- | -- |
Source: Public Records
Mortgage History
| Date | Status | Borrower | Loan Amount |
|---|---|---|---|
| Previous Owner | Hernandez Rafael | $175,035 |
Source: Public Records
Tax History
| Year | Tax Paid | Tax Assessment Tax Assessment Total Assessment is a certain percentage of the fair market value that is determined by local assessors to be the total taxable value of land and additions on the property. | Land | Improvement |
|---|---|---|---|---|
| 2025 | $7,733 | $285,312 | $50,314 | $234,998 |
| 2024 | $7,733 | $264,937 | $50,314 | $214,623 |
| 2023 | $7,733 | $256,769 | $38,703 | $218,066 |
| 2022 | $7,002 | $224,190 | $38,700 | $185,490 |
| 2021 | $5,746 | $179,280 | $38,700 | $140,580 |
| 2020 | $5,655 | $174,950 | $35,210 | $139,740 |
| 2019 | $5,492 | $162,290 | $32,010 | $130,280 |
| 2018 | $5,407 | $157,210 | $32,010 | $125,200 |
| 2017 | $5,403 | $156,870 | $32,010 | $124,860 |
| 2016 | $446 | $12,960 | $12,960 | $0 |
| 2015 | $79 | $4,000 | $4,000 | $0 |
Source: Public Records
Map
Nearby Homes
- 4718 Sedgewood Dr
- 3010 Coachmaker Trail
- 3011 Tandem Ct
- 3026 Currier Ct
- 2810 Meadowbrook Ln
- 3035 Tandem Ct
- 3034 Tandem Ct
- 4914 Mountain Maple Trail
- 4610 Beechwood Dr
- 4922 Mountain Maple Trail
- 4508 Coopers Hill Trail
- 2927 Canoe Birch Ct
- 4303 Greeley Ln
- 4206 Brightridge Ct
- 4518 Antero Ct
- 4922 Lacebark Pine Trail
- 4414 Kayden Berry Ct
- 3127 Everwood Trail
- 3038 Spitfire Dr
- 3034 Spitfire Dr
- 4703 Wheelwright Trail
- 4615 Wheelwright Trail
- 4707 Wheel Wright Trail
- 4618 Wheel Wright Trail
- 4711 Wheelwright Trail
- 4711 Wheel Wright Trail
- 4702 Wheel Wright Trail
- 4614 Wheel Wright Trail
- 4706 Wheel Wright Trail
- 4715 Wheel Wright Trail
- 4710 Wheel Wright Trail
- 4715 Wheelwright Trail
- 4614 Sedgewood Dr
- 4618 Sedgewood Dr
- 4610 Sedgewood Dr
- 4702 Sedgewood Dr
- 4714 Wheel Wright Trail
- 4719 Wheel Wright Trail
- 4719 Wheelwright Trail
- 4706 Sedgewood Dr
Your Personal Tour Guide
Ask me questions while you tour the home.