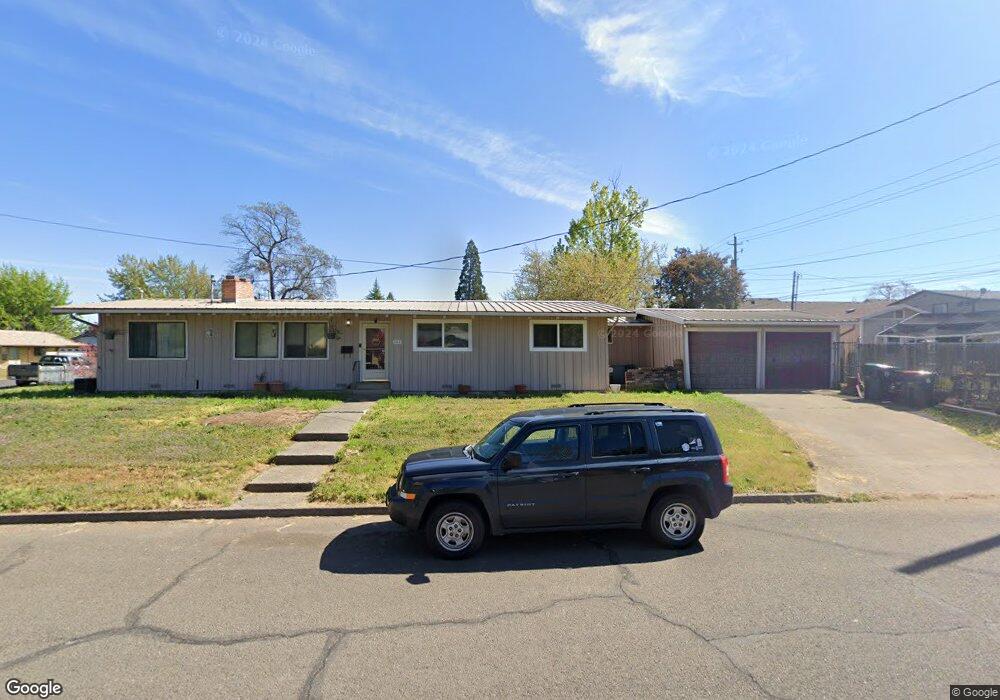
462 N 6th St Central Point, OR 97502
Estimated Value: $347,415 - $384,000
3
Beds
2
Baths
1,522
Sq Ft
$244/Sq Ft
Est. Value
About This Home
This home is located at 462 N 6th St, Central Point, OR 97502 and is currently estimated at $371,854, approximately $244 per square foot. 462 N 6th St is a home located in Jackson County with nearby schools including Jewett Elementary School, Scenic Middle School, and Crater High School.
Ownership History
Date
Name
Owned For
Owner Type
Purchase Details
Closed on
Apr 22, 2021
Sold by
Swanson Richard C and Swanson Gail L
Bought by
Swanson Richard C and Swanson Gail L
Current Estimated Value
Home Financials for this Owner
Home Financials are based on the most recent Mortgage that was taken out on this home.
Original Mortgage
$263,200
Outstanding Balance
$236,287
Interest Rate
3.05%
Mortgage Type
New Conventional
Estimated Equity
$135,567
Purchase Details
Closed on
Apr 15, 2021
Sold by
Fuentes Lisa Anne and Gary Dee Wilkinson Living Trus
Bought by
Swanson Richard C and Swanson Gail L
Home Financials for this Owner
Home Financials are based on the most recent Mortgage that was taken out on this home.
Original Mortgage
$263,200
Outstanding Balance
$236,287
Interest Rate
3.05%
Mortgage Type
New Conventional
Estimated Equity
$135,567
Purchase Details
Closed on
Jan 31, 2020
Sold by
Wilkinson Gary D
Bought by
Wilkinson Gary Dee and Gary Dee Wilkinson Living Trus
Create a Home Valuation Report for This Property
The Home Valuation Report is an in-depth analysis detailing your home's value as well as a comparison with similar homes in the area
Purchase History
| Date | Buyer | Sale Price | Title Company |
|---|---|---|---|
| Swanson Richard C | -- | Ticor Title | |
| Swanson Richard C | $329,000 | Ticor Title | |
| Wilkinson Gary Dee | -- | None Available |
Source: Public Records
Mortgage History
| Date | Status | Borrower | Loan Amount |
|---|---|---|---|
| Open | Swanson Richard C | $263,200 |
Source: Public Records
Tax History
| Year | Tax Paid | Tax Assessment Tax Assessment Total Assessment is a certain percentage of the fair market value that is determined by local assessors to be the total taxable value of land and additions on the property. | Land | Improvement |
|---|---|---|---|---|
| 2026 | $3,035 | $183,400 | -- | -- |
| 2025 | $2,961 | $178,060 | $51,250 | $126,810 |
| 2024 | $2,961 | $172,880 | $49,760 | $123,120 |
| 2023 | $2,865 | $167,850 | $48,320 | $119,530 |
| 2022 | $2,799 | $167,850 | $48,320 | $119,530 |
| 2021 | $2,719 | $162,970 | $46,910 | $116,060 |
| 2020 | $2,639 | $158,230 | $45,540 | $112,690 |
| 2019 | $2,574 | $149,160 | $42,920 | $106,240 |
| 2018 | $2,496 | $144,820 | $41,670 | $103,150 |
| 2017 | $2,433 | $144,820 | $41,670 | $103,150 |
| 2016 | $2,362 | $136,520 | $39,270 | $97,250 |
| 2015 | $2,263 | $136,520 | $39,270 | $97,250 |
| 2014 | $2,206 | $128,690 | $37,010 | $91,680 |
Source: Public Records
Map
Nearby Homes
- 331 N 8th St
- 55 Crater Ln
- 731 Maple St
- 342 Hazel St
- 833 Hazel St
- 0 N 3rd St
- 144 N 5th St
- 140 N 8th St
- 106 Victoria Way
- 0 Peninger Rd
- 4626 N Pacific Hwy
- 350 Alder St
- 220 S 3rd St
- 626 Griffin Oaks Dr
- 659 Blue Moon Dr
- 0 Boulder Ridge St
- 650 Golden Peak Dr
- 356 Marian Ave Unit 40
- 114 Cedar St
- 185 Logan Ave
Your Personal Tour Guide
Ask me questions while you tour the home.