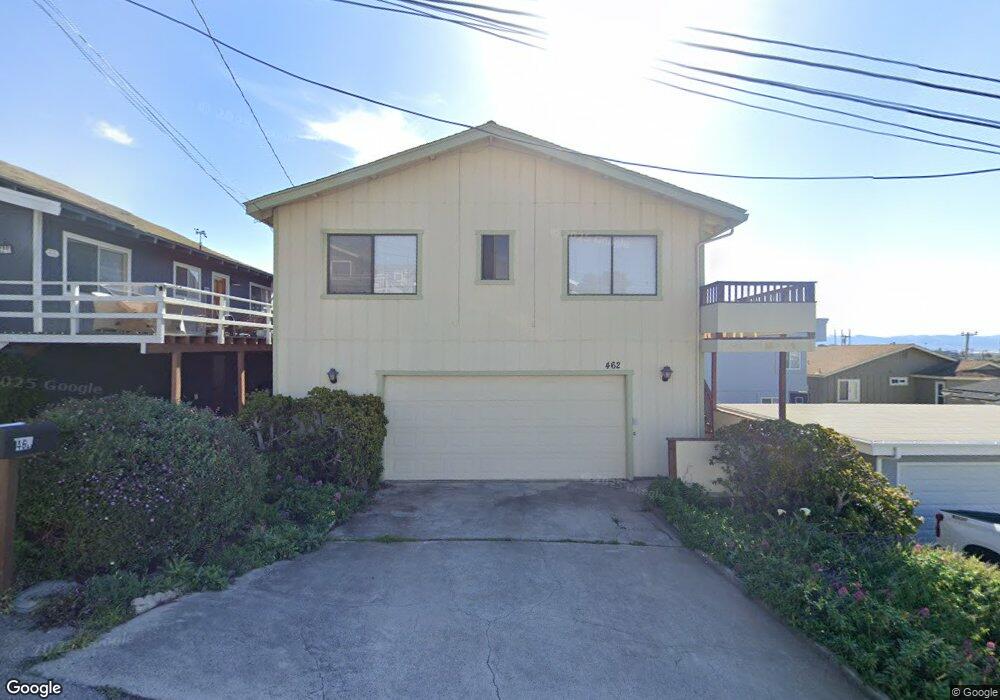
462 Orcas St Morro Bay, CA 93442
Estimated Value: $788,000 - $1,006,000
4
Beds
3
Baths
2,012
Sq Ft
$450/Sq Ft
Est. Value
About This Home
This home is located at 462 Orcas St, Morro Bay, CA 93442 and is currently estimated at $906,116, approximately $450 per square foot. 462 Orcas St is a home located in San Luis Obispo County with nearby schools including Del Mar Elementary School, Los Osos Middle School, and Morro Bay High School.
Ownership History
Date
Name
Owned For
Owner Type
Purchase Details
Closed on
Nov 22, 2023
Sold by
Harshman John and Harshman Janice M
Bought by
Harshman Family Revocable Trust and Harshman
Current Estimated Value
Purchase Details
Closed on
Dec 5, 2002
Sold by
Harwick Theodore S
Bought by
Harshman John and Harshman Janice M
Purchase Details
Closed on
Apr 16, 1998
Sold by
Harwick Theodore S
Bought by
Harwick Theodore S and Tsh Living Trust
Create a Home Valuation Report for This Property
The Home Valuation Report is an in-depth analysis detailing your home's value as well as a comparison with similar homes in the area
Home Values in the Area
Average Home Value in this Area
Purchase History
| Date | Buyer | Sale Price | Title Company |
|---|---|---|---|
| Harshman Family Revocable Trust | -- | None Listed On Document | |
| Harshman John | $65,000 | Chicago Title Company | |
| Harwick Theodore S | -- | -- |
Source: Public Records
Tax History
| Year | Tax Paid | Tax Assessment Tax Assessment Total Assessment is a certain percentage of the fair market value that is determined by local assessors to be the total taxable value of land and additions on the property. | Land | Improvement |
|---|---|---|---|---|
| 2025 | $4,098 | $378,256 | $187,469 | $190,787 |
| 2024 | $4,024 | $370,841 | $183,794 | $187,047 |
| 2023 | $4,024 | $363,571 | $180,191 | $183,380 |
| 2022 | $3,772 | $356,443 | $176,658 | $179,785 |
| 2021 | $3,712 | $349,455 | $173,195 | $176,260 |
| 2020 | $3,674 | $345,873 | $171,420 | $174,453 |
| 2019 | $3,636 | $339,092 | $168,059 | $171,033 |
| 2018 | $3,565 | $332,444 | $164,764 | $167,680 |
| 2017 | $3,495 | $325,927 | $161,534 | $164,393 |
| 2016 | $3,426 | $319,537 | $158,367 | $161,170 |
| 2015 | $3,374 | $314,739 | $155,989 | $158,750 |
| 2014 | $3,098 | $308,575 | $152,934 | $155,641 |
Source: Public Records
Map
Nearby Homes
- 498 Orcas St
- 390 Nassau St
- 351 Nevis St
- 175 Tahiti St
- 410 Island St
- 3058 Main St
- 670 Sequoia Ct
- 650 Sequoia Ct
- 2900 Alder Ave
- 5010 Cabrillo Hwy
- 2783 Coral Ave
- 2825 Hemlock Ave
- 2785 Hemlock Ave
- 679 Elena St
- 2600 Ironwood Ave
- 2581 Juniper Ave
- 2560 Juniper Ave
- 2350 Nutmeg Ave
- 485 Bonita St
- 540 Avalon St
Your Personal Tour Guide
Ask me questions while you tour the home.