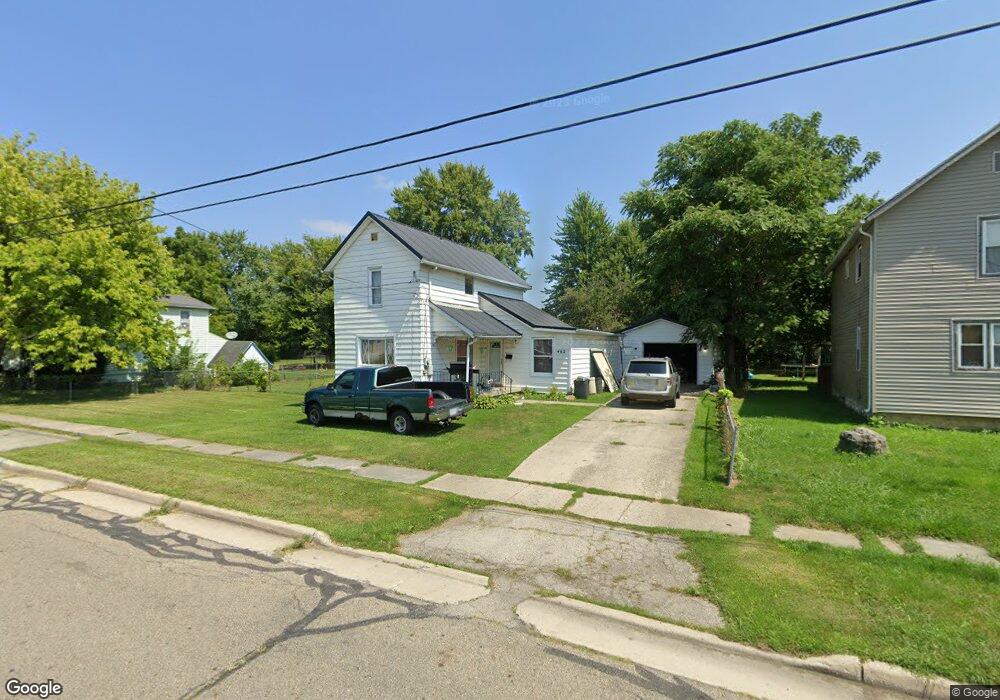
462 Thompson St Marion, OH 43302
Estimated Value: $76,000 - $117,000
4
Beds
2
Baths
1,292
Sq Ft
$71/Sq Ft
Est. Value
About This Home
This home is located at 462 Thompson St, Marion, OH 43302 and is currently estimated at $91,977, approximately $71 per square foot. 462 Thompson St is a home located in Marion County with nearby schools including Rutherford B. Hayes Elementary School, Ulysses S. Grant Middle School, and Harding High School.
Ownership History
Date
Name
Owned For
Owner Type
Purchase Details
Closed on
Jan 29, 2025
Sold by
Chafin Robert L and Chafin Barbara A
Bought by
Burt Jeffrey D
Current Estimated Value
Home Financials for this Owner
Home Financials are based on the most recent Mortgage that was taken out on this home.
Original Mortgage
$3,575
Outstanding Balance
$3,547
Interest Rate
6.72%
Estimated Equity
$88,431
Purchase Details
Closed on
Jul 8, 2015
Sold by
Chafin Robert and Chafin Robert L
Bought by
Chafin Robert L and Chafin Barbara A
Purchase Details
Closed on
Jun 2, 2015
Sold by
Mullins Kathy A
Bought by
Chafin Robert
Purchase Details
Closed on
Jul 25, 2014
Sold by
Mullins Kathy A
Bought by
Chafin Robert
Purchase Details
Closed on
Feb 13, 1995
Bought by
Chafin Robert L and Chafin Barbara A
Create a Home Valuation Report for This Property
The Home Valuation Report is an in-depth analysis detailing your home's value as well as a comparison with similar homes in the area
Home Values in the Area
Average Home Value in this Area
Purchase History
| Date | Buyer | Sale Price | Title Company |
|---|---|---|---|
| Burt Jeffrey D | $71,500 | None Listed On Document | |
| Burt Jeffrey D | $71,500 | None Listed On Document | |
| Chafin Robert L | -- | Attorney | |
| Chafin Robert | $9,000 | Attorney | |
| Chafin Robert | $90,000 | None Available | |
| Chafin Robert L | -- | -- |
Source: Public Records
Mortgage History
| Date | Status | Borrower | Loan Amount |
|---|---|---|---|
| Open | Burt Jeffrey D | $3,575 | |
| Closed | Burt Jeffrey D | $3,575 | |
| Open | Burt Jeffrey D | $70,204 | |
| Closed | Burt Jeffrey D | $70,204 |
Source: Public Records
Tax History Compared to Growth
Tax History
| Year | Tax Paid | Tax Assessment Tax Assessment Total Assessment is a certain percentage of the fair market value that is determined by local assessors to be the total taxable value of land and additions on the property. | Land | Improvement |
|---|---|---|---|---|
| 2024 | $671 | $17,460 | $1,250 | $16,210 |
| 2023 | $671 | $17,460 | $1,250 | $16,210 |
| 2022 | $623 | $17,460 | $1,250 | $16,210 |
| 2021 | $538 | $13,560 | $1,090 | $12,470 |
| 2020 | $539 | $13,560 | $1,090 | $12,470 |
| 2019 | $538 | $13,560 | $1,090 | $12,470 |
| 2018 | $770 | $14,520 | $1,070 | $13,450 |
| 2017 | $1,271 | $14,520 | $1,070 | $13,450 |
| 2016 | $580 | $14,520 | $1,070 | $13,450 |
| 2015 | $581 | $14,240 | $1,030 | $13,210 |
| 2014 | $583 | $14,240 | $1,030 | $13,210 |
| 2013 | $581 | $14,240 | $1,030 | $13,210 |
| 2012 | $710 | $17,250 | $1,450 | $15,800 |
Source: Public Records
Map
Nearby Homes
- 523 Thompson St
- 355 Lee St
- 531 Toledo Ave
- 520 Toledo Ave
- 485 Avondale Ave
- 641 Blake Ave
- 468 Avondale Ave
- 134 Waterloo St
- 551 Universal Ave Unit 555
- 213 Sharp St
- 178 Leader St
- 343 Commercial St
- 347 Mary St
- 636 Mary St
- 233 Tully St
- 325 Holmes Place
- 552 N Prospect St
- 403 Uncapher Ave
- 374 Nunin Ct
- 395 N Main St
- 454 Thompson St
- 474 Thompson St
- 442 Thompson St
- 465 Thompson St
- 451 Thompson St
- 473 Thompson St
- 436 Thompson St
- 441 Thompson St
- 777 Roma St
- 433 Thompson St
- 493 Thompson St
- 481 Thompson St
- 769 Roma St
- 486 Thompson St
- 459 Scranton Ave
- 467 Scranton Ave
- 428 Thompson St
- 475 Scranton Ave
- 494 Thompson St
- 481 Scranton Ave