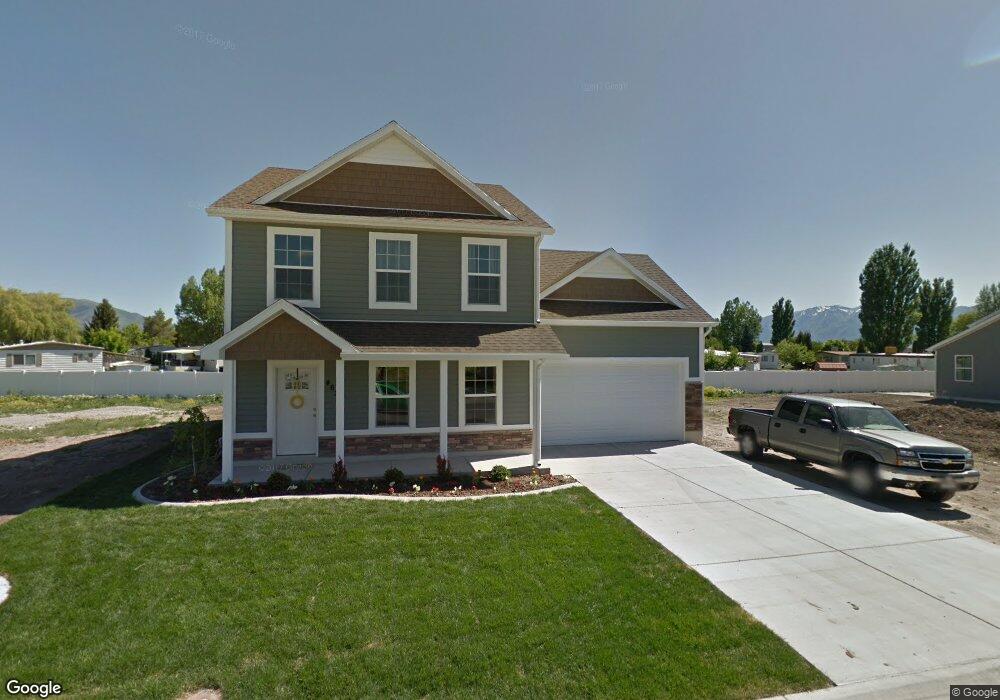
462 W 810 N Logan, UT 84321
Bridger NeighborhoodEstimated Value: $422,000 - $457,000
3
Beds
3
Baths
1,995
Sq Ft
$218/Sq Ft
Est. Value
About This Home
This home is located at 462 W 810 N, Logan, UT 84321 and is currently estimated at $434,092, approximately $217 per square foot. 462 W 810 N is a home located in Cache County with nearby schools including Bridger School, Mount Logan Middle School, and Logan High School.
Ownership History
Date
Name
Owned For
Owner Type
Purchase Details
Closed on
Mar 28, 2019
Sold by
Udy Jenna
Bought by
The Lindley Asset Protection Trust
Current Estimated Value
Purchase Details
Closed on
May 25, 2016
Sold by
Madsen Russell C and Madsen Jamie Lynne
Bought by
Udy Ryan J and Udy Jenna
Home Financials for this Owner
Home Financials are based on the most recent Mortgage that was taken out on this home.
Original Mortgage
$198,412
Outstanding Balance
$156,689
Interest Rate
3.5%
Mortgage Type
FHA
Estimated Equity
$277,403
Purchase Details
Closed on
Jan 4, 2013
Sold by
Ashbury Court Development 2 Llc
Bought by
Madsen Russell C and Madsen Jamie Lynne
Home Financials for this Owner
Home Financials are based on the most recent Mortgage that was taken out on this home.
Original Mortgage
$166,939
Interest Rate
3.27%
Mortgage Type
VA
Create a Home Valuation Report for This Property
The Home Valuation Report is an in-depth analysis detailing your home's value as well as a comparison with similar homes in the area
Home Values in the Area
Average Home Value in this Area
Purchase History
| Date | Buyer | Sale Price | Title Company |
|---|---|---|---|
| The Lindley Asset Protection Trust | -- | None Available | |
| Udy Ryan J | -- | Cache Title Logan | |
| Madsen Russell C | -- | Cache Title Company |
Source: Public Records
Mortgage History
| Date | Status | Borrower | Loan Amount |
|---|---|---|---|
| Open | Udy Ryan J | $198,412 | |
| Previous Owner | Madsen Russell C | $166,939 |
Source: Public Records
Tax History
| Year | Tax Paid | Tax Assessment Tax Assessment Total Assessment is a certain percentage of the fair market value that is determined by local assessors to be the total taxable value of land and additions on the property. | Land | Improvement |
|---|---|---|---|---|
| 2025 | $1,821 | $235,510 | $0 | $0 |
| 2024 | $1,880 | $235,510 | $0 | $0 |
| 2023 | $1,965 | $234,630 | $0 | $0 |
| 2022 | $210 | $234,630 | $0 | $0 |
| 2021 | $1,676 | $288,652 | $42,000 | $246,652 |
| 2020 | $1,654 | $256,480 | $42,000 | $214,480 |
| 2019 | $1,729 | $256,480 | $42,000 | $214,480 |
| 2018 | $1,724 | $233,500 | $42,000 | $191,500 |
| 2017 | $1,648 | $118,030 | $0 | $0 |
| 2016 | $1,709 | $103,345 | $0 | $0 |
| 2015 | $1,498 | $103,345 | $0 | $0 |
| 2014 | $1,354 | $103,345 | $0 | $0 |
| 2013 | -- | $103,345 | $0 | $0 |
Source: Public Records
Map
Nearby Homes
Your Personal Tour Guide
Ask me questions while you tour the home.