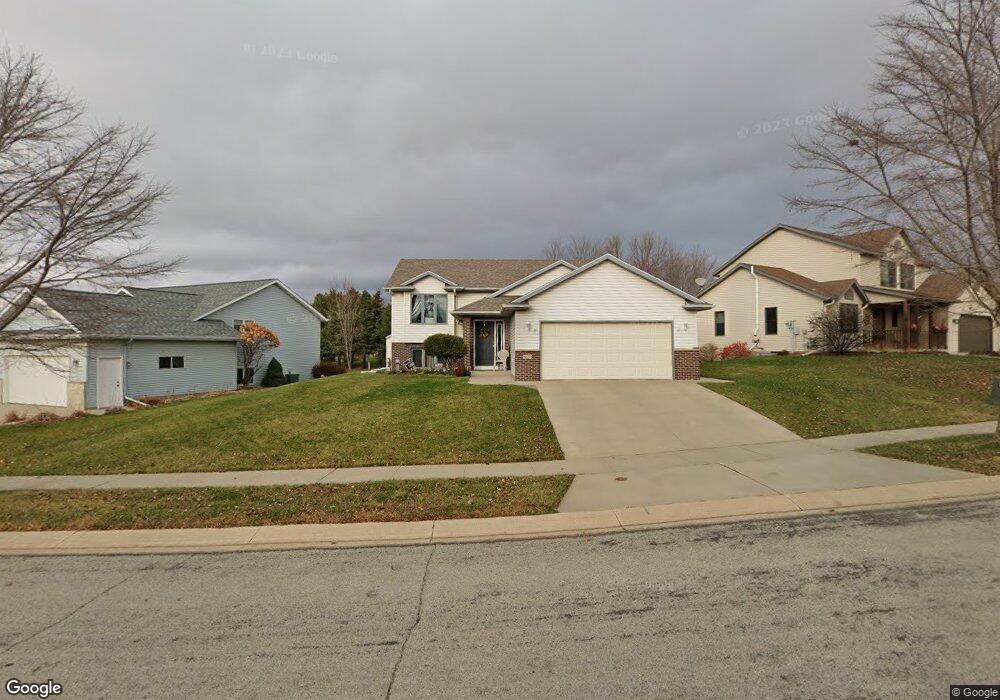
4620 Canterbury Ct NW Rochester, MN 55901
Estimated Value: $328,833 - $367,000
4
Beds
2
Baths
2,040
Sq Ft
$172/Sq Ft
Est. Value
About This Home
This home is located at 4620 Canterbury Ct NW, Rochester, MN 55901 and is currently estimated at $351,458, approximately $172 per square foot. 4620 Canterbury Ct NW is a home located in Olmsted County with nearby schools including John Marshall Senior High School, Rochester Beacon Academy, and Resurrection Lutheran School.
Ownership History
Date
Name
Owned For
Owner Type
Purchase Details
Closed on
Jun 8, 2017
Sold by
Miller Christopher M and Miller Donna R
Bought by
Miller Christopher M and Miller Donna R
Current Estimated Value
Purchase Details
Closed on
Jun 26, 2015
Sold by
Dubey Abhijit and Vege Anupama
Bought by
Miller Christopher M and Miller Donna R
Home Financials for this Owner
Home Financials are based on the most recent Mortgage that was taken out on this home.
Original Mortgage
$86,100
Outstanding Balance
$67,486
Interest Rate
4.01%
Mortgage Type
New Conventional
Estimated Equity
$283,972
Purchase Details
Closed on
Sep 22, 2005
Sold by
Wang Hai Long and Wang Fei
Bought by
Dubey Abhijit and Vege Anupama S
Home Financials for this Owner
Home Financials are based on the most recent Mortgage that was taken out on this home.
Original Mortgage
$166,400
Interest Rate
4.86%
Mortgage Type
Adjustable Rate Mortgage/ARM
Create a Home Valuation Report for This Property
The Home Valuation Report is an in-depth analysis detailing your home's value as well as a comparison with similar homes in the area
Home Values in the Area
Average Home Value in this Area
Purchase History
| Date | Buyer | Sale Price | Title Company |
|---|---|---|---|
| Miller Christopher M | -- | None Available | |
| Miller Christopher M | $183,100 | Title Services Inc | |
| Dubey Abhijit | $184,900 | Rochester Title |
Source: Public Records
Mortgage History
| Date | Status | Borrower | Loan Amount |
|---|---|---|---|
| Open | Miller Christopher M | $86,100 | |
| Previous Owner | Dubey Abhijit | $166,400 |
Source: Public Records
Tax History Compared to Growth
Tax History
| Year | Tax Paid | Tax Assessment Tax Assessment Total Assessment is a certain percentage of the fair market value that is determined by local assessors to be the total taxable value of land and additions on the property. | Land | Improvement |
|---|---|---|---|---|
| 2024 | $3,924 | $296,700 | $50,000 | $246,700 |
| 2023 | $3,470 | $285,400 | $50,000 | $235,400 |
| 2022 | $3,168 | $271,200 | $50,000 | $221,200 |
| 2021 | $3,048 | $243,400 | $50,000 | $193,400 |
| 2020 | $3,000 | $235,000 | $40,000 | $195,000 |
| 2019 | $2,840 | $223,500 | $40,000 | $183,500 |
| 2018 | $2,593 | $214,000 | $40,000 | $174,000 |
| 2017 | $2,550 | $199,600 | $40,000 | $159,600 |
| 2016 | $2,166 | $171,600 | $35,800 | $135,800 |
| 2015 | $2,332 | $142,000 | $34,500 | $107,500 |
| 2014 | $2,330 | $166,000 | $40,000 | $126,000 |
| 2012 | -- | $169,000 | $40,000 | $129,000 |
Source: Public Records
Map
Nearby Homes
- 1129 Essex Pkwy NW
- 928 Milborne Ln NW
- Mckinley Plan at Essex Estates
- Sinclair Plan at Essex Estates
- Lewis Plan at Essex Estates
- Vanderbilt Plan at Essex Estates
- 892 Brighton Dr NW
- 914 Milborne Ln NW
- 923 Milborne Ln NW
- 4594 Buckingham Dr NW
- 4618 Buckingham Dr NW
- 917 Milborne Ln NW
- 874 Londonderry Dr NW
- 885 Picadilly Ln NW
- 877 Picadilly Ln NW
- 870 Portsmith Dr NW
- 5201 Harvest Square Place NW
- 3916 17th Ave NW
- 4017 18th Ave NW
- xxxx 18th Ave NW
- 4626 Canterbury Ct NW
- 4614 Canterbury Ct NW
- 4632 Canterbury Ct NW
- 4608 Canterbury Ct NW
- 1032 Essex Pkwy NW
- 4619 Canterbury Ct NW
- 4638 Canterbury Ct NW
- 4623 Canterbury Ct NW
- 1038 Essex Pkwy NW
- 4615 Canterbury Ct NW
- 4627 Canterbury Ct NW
- 4611 Canterbury Ct NW
- 4631 Canterbury Ct NW
- 4706 Canterbury Ct NW
- 4607 Canterbury Ct NW
- 4603 Canterbury Ct NW
- 4635 Canterbury Ct NW
- 4712 Canterbury Ct NW
- 4639 Canterbury Ct NW
- 1046 Essex Pkwy NW