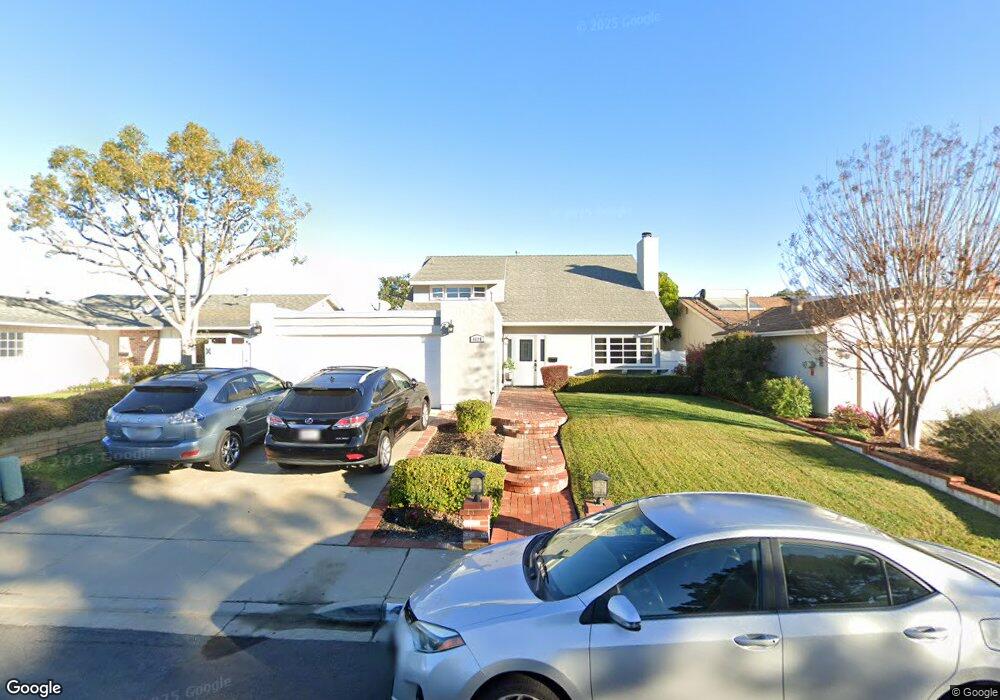
4620 Huggins St San Diego, CA 92122
University City NeighborhoodEstimated Value: $1,439,453 - $1,684,000
4
Beds
2
Baths
1,710
Sq Ft
$937/Sq Ft
Est. Value
About This Home
This home is located at 4620 Huggins St, San Diego, CA 92122 and is currently estimated at $1,603,113, approximately $937 per square foot. 4620 Huggins St is a home located in San Diego County with nearby schools including Marie Curie Elementary School, Standley Middle School, and University City High School.
Ownership History
Date
Name
Owned For
Owner Type
Purchase Details
Closed on
Apr 18, 2019
Sold by
Zappia Charles A and Zappia Mary Jane S
Bought by
Zappia Charles A and Zappia Mary Jane S
Current Estimated Value
Purchase Details
Closed on
Aug 27, 2003
Sold by
Stevenson Kathryn A
Bought by
Zappia Charles A and Zappia Mary Jane S
Home Financials for this Owner
Home Financials are based on the most recent Mortgage that was taken out on this home.
Original Mortgage
$468,000
Outstanding Balance
$216,807
Interest Rate
6.22%
Mortgage Type
Purchase Money Mortgage
Estimated Equity
$1,386,306
Purchase Details
Closed on
Jul 19, 1999
Sold by
Tim Walters
Bought by
Stevenson Kathryn
Home Financials for this Owner
Home Financials are based on the most recent Mortgage that was taken out on this home.
Original Mortgage
$328,135
Interest Rate
5.55%
Purchase Details
Closed on
Apr 6, 1998
Sold by
David Gehrke and David Susan C
Bought by
Walters Tim and Walters Wendy
Home Financials for this Owner
Home Financials are based on the most recent Mortgage that was taken out on this home.
Original Mortgage
$246,000
Interest Rate
6.5%
Purchase Details
Closed on
Oct 28, 1988
Create a Home Valuation Report for This Property
The Home Valuation Report is an in-depth analysis detailing your home's value as well as a comparison with similar homes in the area
Home Values in the Area
Average Home Value in this Area
Purchase History
| Date | Buyer | Sale Price | Title Company |
|---|---|---|---|
| Zappia Charles A | -- | None Available | |
| Zappia Charles A | $585,000 | First American Title | |
| Stevenson Kathryn | $365,000 | Chicago Title Co | |
| Walters Tim | $307,500 | Chicago Title Co | |
| -- | $235,000 | -- |
Source: Public Records
Mortgage History
| Date | Status | Borrower | Loan Amount |
|---|---|---|---|
| Open | Zappia Charles A | $468,000 | |
| Previous Owner | Stevenson Kathryn | $328,135 | |
| Previous Owner | Walters Tim | $246,000 |
Source: Public Records
Tax History Compared to Growth
Tax History
| Year | Tax Paid | Tax Assessment Tax Assessment Total Assessment is a certain percentage of the fair market value that is determined by local assessors to be the total taxable value of land and additions on the property. | Land | Improvement |
|---|---|---|---|---|
| 2025 | $9,963 | $831,711 | $639,779 | $191,932 |
| 2024 | $9,963 | $815,404 | $627,235 | $188,169 |
| 2023 | $9,741 | $799,417 | $614,937 | $184,480 |
| 2022 | $9,481 | $783,743 | $602,880 | $180,863 |
| 2021 | $9,414 | $768,376 | $591,059 | $177,317 |
| 2020 | $9,300 | $760,498 | $584,999 | $175,499 |
| 2019 | $9,132 | $745,587 | $573,529 | $172,058 |
| 2018 | $8,536 | $730,969 | $562,284 | $168,685 |
| 2017 | $81 | $670,000 | $513,000 | $157,000 |
| 2016 | $7,698 | $660,000 | $506,000 | $154,000 |
| 2015 | $7,582 | $650,000 | $499,000 | $151,000 |
| 2014 | $6,373 | $545,000 | $419,000 | $126,000 |
Source: Public Records
Map
Nearby Homes
- 4627 Huggins St
- 4635 Pauling Ave
- 7056 Haworth St
- 7190 Shoreline Dr Unit 6313
- 7212 Florey St
- 7160 Shoreline Dr Unit 4213
- 4282 Robbins St
- 4612 Benhurst Ave
- 7224 Shoreline Dr Unit 172
- 4224 Governor Dr
- 7182 Calabria Ct Unit A
- 6214 Agee St Unit 34
- 7285 Calabria Ct Unit 18
- 7132 Calabria Ct
- 6547 Radcliffe Dr
- 6188 Agee St Unit 230
- 6180 Agee St Unit 159
- 6330 Genesee Ave Unit 319
- 6330 Genesee Ave Unit 220
- 6330 Genesee Ave Unit 119
- 4630 Huggins St
- 4610 Huggins St
- 4640 Huggins St
- 4590 Huggins St
- 4619 Huggins Way
- 4609 Huggins Way
- 4580 Huggins St
- 4650 Huggins St
- 4617 Huggins St
- 4629 Huggins Way
- 4608 Huggins Way
- 4583 Huggins St
- 4635 Huggins St
- 4570 Huggins St
- 4660 Huggins St
- 4639 Huggins Way
- 4573 Huggins St
- 4612 Huggins Way
- 4643 Huggins St
- 4560 Huggins St