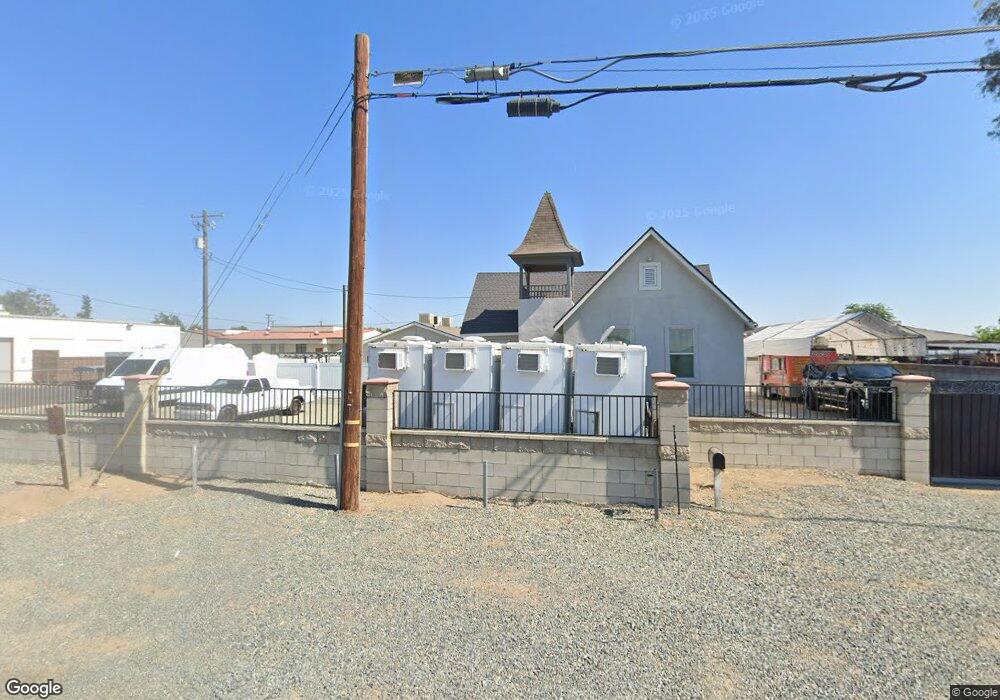
4620 Tafty Hwy Hwy Bakersfield, CA 93313
Panama NeighborhoodEstimated Value: $624,000 - $777,000
--
Bed
3
Baths
4,545
Sq Ft
$152/Sq Ft
Est. Value
About This Home
This home is located at 4620 Tafty Hwy Hwy, Bakersfield, CA 93313 and is currently estimated at $692,896, approximately $152 per square foot. 4620 Tafty Hwy Hwy is a home located in Kern County with nearby schools including Panama Elementary School, Stonecreek Junior High School, and Ridgeview High School.
Ownership History
Date
Name
Owned For
Owner Type
Purchase Details
Closed on
Jun 4, 2024
Sold by
Henderson Tanner Ryan
Bought by
Sullivan Donald Lee and Sierra Carlos
Current Estimated Value
Home Financials for this Owner
Home Financials are based on the most recent Mortgage that was taken out on this home.
Original Mortgage
$506,715
Outstanding Balance
$500,211
Interest Rate
6.99%
Mortgage Type
FHA
Estimated Equity
$192,685
Purchase Details
Closed on
Jan 15, 2020
Sold by
Henderson Dean and Henderson Kelly
Bought by
Henderson Tanner Ryan
Home Financials for this Owner
Home Financials are based on the most recent Mortgage that was taken out on this home.
Original Mortgage
$230,000
Interest Rate
3.4%
Purchase Details
Closed on
Oct 26, 2009
Sold by
Boyles Robert Larry
Bought by
Boyles Robert Larry
Create a Home Valuation Report for This Property
The Home Valuation Report is an in-depth analysis detailing your home's value as well as a comparison with similar homes in the area
Home Values in the Area
Average Home Value in this Area
Purchase History
| Date | Buyer | Sale Price | Title Company |
|---|---|---|---|
| Sullivan Donald Lee | $550,000 | First American Title | |
| Henderson Tanner Ryan | $400,000 | Chicago Title Company | |
| Boyles Robert Larry | -- | None Available | |
| Henderson Dean | -- | None Available |
Source: Public Records
Mortgage History
| Date | Status | Borrower | Loan Amount |
|---|---|---|---|
| Open | Sullivan Donald Lee | $506,715 | |
| Previous Owner | Henderson Tanner Ryan | $230,000 |
Source: Public Records
Tax History Compared to Growth
Tax History
| Year | Tax Paid | Tax Assessment Tax Assessment Total Assessment is a certain percentage of the fair market value that is determined by local assessors to be the total taxable value of land and additions on the property. | Land | Improvement |
|---|---|---|---|---|
| 2025 | $6,019 | $550,000 | $113,000 | $437,000 |
| 2024 | $6,019 | $459,657 | $86,426 | $373,231 |
| 2023 | $5,754 | $450,646 | $84,732 | $365,914 |
| 2022 | $5,528 | $441,811 | $83,071 | $358,740 |
| 2021 | $5,404 | $433,149 | $81,443 | $351,706 |
| 2020 | $5,543 | $443,105 | $82,840 | $360,265 |
| 2019 | $5,140 | $443,105 | $82,840 | $360,265 |
| 2018 | $4,898 | $425,902 | $79,624 | $346,278 |
| 2017 | $4,808 | $417,552 | $78,063 | $339,489 |
| 2016 | $4,484 | $409,366 | $76,533 | $332,833 |
| 2015 | $4,473 | $403,219 | $75,384 | $327,835 |
| 2014 | $4,365 | $395,322 | $73,908 | $321,414 |
Source: Public Records
Map
Nearby Homes
- 4620 Taft Hwy
- 5103 Green Clover Ave
- 9623 Kanosh Cobble Dr
- 4403 Oceanrock Ave
- 5407 Red Wheat Ave
- 9402 Cobble Mountain Rd
- 9003 Great Harvest Dr
- 9301 Cobble Mountain Rd
- 4614 Crosshaven Ave Unit 1
- 5808 Esmerelda Ave
- 5831 Mardal Ave
- 9202 Mcclintock Rd
- 3603 Chisholm Trail Ave
- 3527 Big Trail Ave
- 6021 Bogart Dr
- 5400 Saddleback Ridge Ct
- 6028 Bogart Dr
- 5815 Pearl Ridge Dr
- 4606 Sun Devils Ave
- 6115 Cape Cod Ave
- 4600 Taft Hwy
- 4542 Taft Hwy
- 4522 Taft Hwy
- 4946 Taft Hwy
- 5000 Taft Hwy
- 9559 Stine Rd
- 5001 Winter Pasture Ave
- 9418 Golden Wheat Dr
- 5005 Winter Pasture Ave
- 9414 Golden Wheat Dr
- 5009 Winter Pasture Ave
- 9410 Golden Wheat Dr
- 5013 Winter Pasture Ave
- 5032 Taft Hwy
- 9406 Golden Wheat Dr
- 9602 Square Bale Ct
- 5017 Winter Pasture Ave Unit 1
- 5000 Winter Pasture Ave
- 9512 Square Bale Ct
- 9402 Golden Wheat Dr