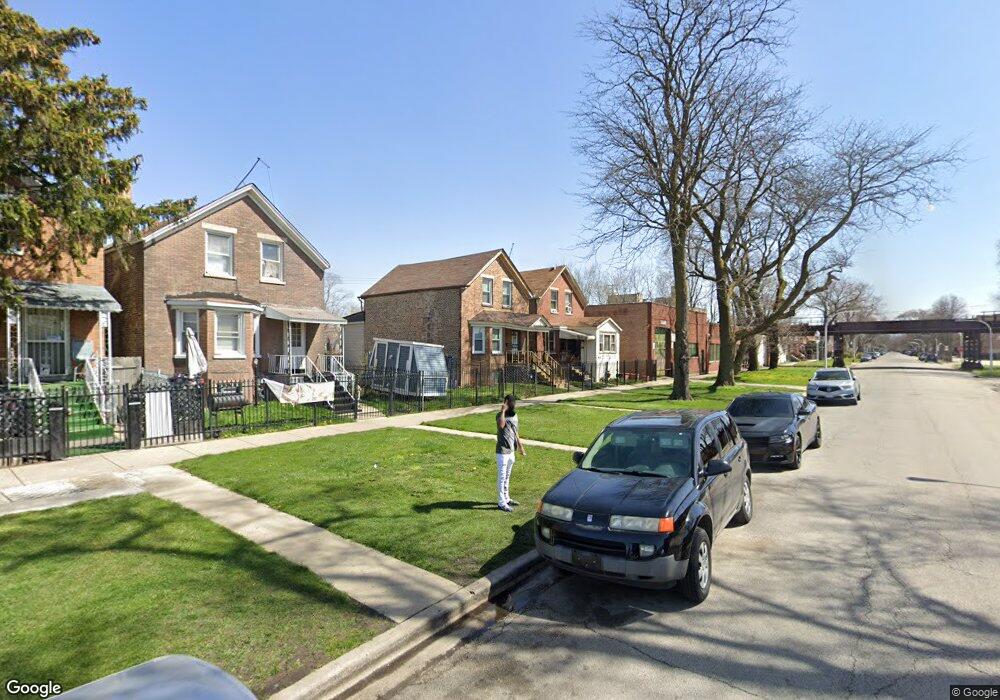
4620 W Maypole Ave Chicago, IL 60644
Garfield Park NeighborhoodEstimated Value: $132,000 - $192,000
3
Beds
2
Baths
646
Sq Ft
$253/Sq Ft
Est. Value
About This Home
This home is located at 4620 W Maypole Ave, Chicago, IL 60644 and is currently estimated at $163,238, approximately $252 per square foot. 4620 W Maypole Ave is a home located in Cook County with nearby schools including Tilton Elementary School, Marshall Metropolitan High School, and KIPP Academy Chicago Campus.
Ownership History
Date
Name
Owned For
Owner Type
Purchase Details
Closed on
Sep 12, 2007
Sold by
Arch Pro Llc
Bought by
Luszcz Wojciech
Current Estimated Value
Purchase Details
Closed on
Sep 18, 1996
Sold by
Gaston Mae Sue
Bought by
Moore Monica M
Home Financials for this Owner
Home Financials are based on the most recent Mortgage that was taken out on this home.
Original Mortgage
$55,419
Interest Rate
7.95%
Mortgage Type
FHA
Purchase Details
Closed on
Sep 13, 1996
Sold by
Ward Sharon Kaye
Bought by
Moore Monica M
Home Financials for this Owner
Home Financials are based on the most recent Mortgage that was taken out on this home.
Original Mortgage
$55,419
Interest Rate
7.95%
Mortgage Type
FHA
Purchase Details
Closed on
Sep 9, 1996
Sold by
Ward Llyod H
Bought by
Moore Monica M
Home Financials for this Owner
Home Financials are based on the most recent Mortgage that was taken out on this home.
Original Mortgage
$55,419
Interest Rate
7.95%
Mortgage Type
FHA
Create a Home Valuation Report for This Property
The Home Valuation Report is an in-depth analysis detailing your home's value as well as a comparison with similar homes in the area
Home Values in the Area
Average Home Value in this Area
Purchase History
| Date | Buyer | Sale Price | Title Company |
|---|---|---|---|
| Luszcz Wojciech | -- | Acquest Title Services Llc | |
| Moore Monica M | $54,000 | Attorneys Natl Title Network | |
| Moore Monica M | -- | Attorneys Natl Title Network | |
| Moore Monica M | -- | Attorneys Natl Title Network | |
| Moore Monica M | -- | Attorneys Natl Title Network | |
| Moore Monica M | -- | Attorneys Natl Title Network |
Source: Public Records
Mortgage History
| Date | Status | Borrower | Loan Amount |
|---|---|---|---|
| Previous Owner | Moore Monica M | $55,419 |
Source: Public Records
Tax History Compared to Growth
Tax History
| Year | Tax Paid | Tax Assessment Tax Assessment Total Assessment is a certain percentage of the fair market value that is determined by local assessors to be the total taxable value of land and additions on the property. | Land | Improvement |
|---|---|---|---|---|
| 2024 | $144 | $8,900 | $3,915 | $4,985 |
| 2023 | $119 | $4,000 | $2,144 | $1,856 |
| 2022 | $119 | $4,000 | $2,144 | $1,856 |
| 2021 | $134 | $3,999 | $2,143 | $1,856 |
| 2020 | $1,314 | $9,003 | $3,172 | $5,831 |
| 2019 | $1,321 | $10,004 | $3,172 | $6,832 |
| 2018 | $1,298 | $10,004 | $3,172 | $6,832 |
| 2017 | $1,476 | $10,234 | $2,835 | $7,399 |
| 2016 | $1,550 | $10,234 | $2,835 | $7,399 |
| 2015 | $1,395 | $10,234 | $2,835 | $7,399 |
| 2014 | $1,395 | $10,088 | $2,700 | $7,388 |
| 2013 | $1,356 | $10,088 | $2,700 | $7,388 |
Source: Public Records
Map
Nearby Homes
- 4718 W Maypole Ave
- 223 N Kolmar Ave
- 4543 W West End Ave
- 4501 W Maypole Ave
- 4720 W Washington Blvd
- 4432 W Maypole Ave
- 257 N Kilbourn Ave
- 231 N La Crosse Ave
- 155 N La Crosse Ave
- 4407 W Maypole Ave
- 206 N La Crosse Ave
- 4810 W Washington Blvd
- 4818 W Washington Blvd
- 201 N Lamon Ave
- 4456 W Madison St
- 217 N Kostner Ave
- 4821 W Washington Blvd
- 4626 W Monroe St
- 4704 W Monroe St
- 4718 W Monroe St
- 4622 W Maypole Ave
- 4626 W Maypole Ave
- 4628 W Maypole Ave
- 4630 W Maypole Ave
- 4658 W Maypole Ave
- 4637 W Fulton St
- 4639 W Fulton St
- 4646 W Maypole Ave Unit 1
- 4646 W Maypole Ave
- 4641 W Fulton St
- 4643 W Fulton St
- 4550 W Maypole Ave
- 4647 W Fulton St
- 4650 W Maypole Ave Unit 2
- 4548 W Maypole Ave
- 15133 Fulton
- 4652 W Maypole Ave
- 4649 W Fulton St
- 4546 W Maypole Ave
- 4551 W Fulton St