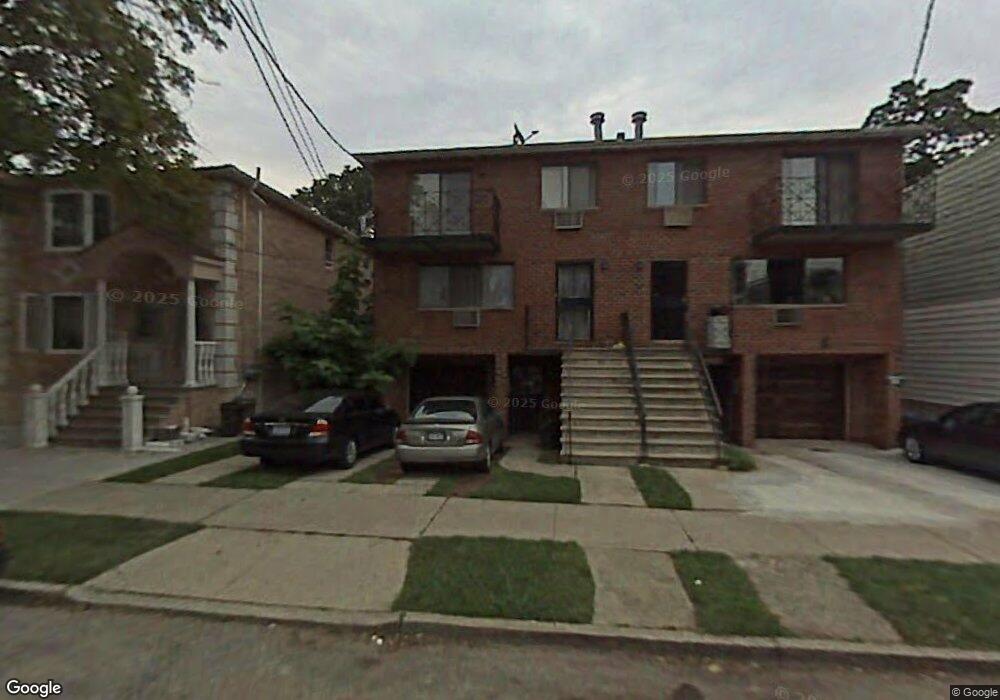
4621 161st St Flushing, NY 11358
Flushing NeighborhoodEstimated Value: $1,586,701 - $2,153,000
--
Bed
--
Bath
3,040
Sq Ft
$599/Sq Ft
Est. Value
About This Home
This home is located at 4621 161st St, Flushing, NY 11358 and is currently estimated at $1,820,925, approximately $598 per square foot. 4621 161st St is a home located in Queens County with nearby schools including Rachel Carson I.S. 237Q, Francis Lewis High School, and Muslim Center Junior High School.
Ownership History
Date
Name
Owned For
Owner Type
Purchase Details
Closed on
Sep 22, 2008
Sold by
Liao Jackson and Liao Max H
Bought by
Gao Yuan Hai and Guan Liping
Current Estimated Value
Home Financials for this Owner
Home Financials are based on the most recent Mortgage that was taken out on this home.
Original Mortgage
$430,000
Outstanding Balance
$285,115
Interest Rate
6.54%
Mortgage Type
Purchase Money Mortgage
Estimated Equity
$1,535,810
Purchase Details
Closed on
Jul 7, 2004
Sold by
Liao Max H and Max H Liao As Executor
Bought by
Liao Max H
Create a Home Valuation Report for This Property
The Home Valuation Report is an in-depth analysis detailing your home's value as well as a comparison with similar homes in the area
Home Values in the Area
Average Home Value in this Area
Purchase History
| Date | Buyer | Sale Price | Title Company |
|---|---|---|---|
| Gao Yuan Hai | $930,000 | -- | |
| Gao Yuan Hai | $930,000 | -- | |
| Liao Max H | -- | -- | |
| Liao Max H | -- | -- |
Source: Public Records
Mortgage History
| Date | Status | Borrower | Loan Amount |
|---|---|---|---|
| Open | Gao Yuan Hai | $430,000 | |
| Closed | Gao Yuan Hai | $430,000 |
Source: Public Records
Tax History Compared to Growth
Tax History
| Year | Tax Paid | Tax Assessment Tax Assessment Total Assessment is a certain percentage of the fair market value that is determined by local assessors to be the total taxable value of land and additions on the property. | Land | Improvement |
|---|---|---|---|---|
| 2025 | $12,713 | $67,880 | $15,289 | $52,591 |
| 2024 | $12,725 | $64,696 | $15,850 | $48,846 |
| 2023 | $12,337 | $62,825 | $15,080 | $47,745 |
| 2022 | $11,545 | $90,960 | $23,460 | $67,500 |
| 2021 | $12,086 | $84,300 | $23,460 | $60,840 |
| 2020 | $11,678 | $92,400 | $23,460 | $68,940 |
| 2019 | $10,985 | $79,140 | $23,460 | $55,680 |
| 2018 | $10,375 | $52,354 | $16,890 | $35,464 |
| 2017 | $9,769 | $49,392 | $15,574 | $33,818 |
| 2016 | $9,492 | $49,392 | $15,574 | $33,818 |
| 2015 | $5,400 | $47,139 | $17,790 | $29,349 |
| 2014 | $5,400 | $44,928 | $20,354 | $24,574 |
Source: Public Records
Map
Nearby Homes
- 4620 161st St Unit B2
- 46-12 161st St Unit 1D
- 46-12 161st St Unit 3B
- 45-57 160th St
- 162-19 Laburnum Ave
- 46-05 158th St
- 47-18 163rd St
- 46-43 157th St
- 157-18 Laburnum Ave
- 45-35 163rd St
- 45-57 157th St
- 45-14 161st St
- 45-11 160th St
- 157-51 Rose Ave
- 163-02 45th Ave
- 148-29 Laburnum Ave
- 45-11 157th St
- 47-23 164th St
- 148-24 Kalmia Ave
- 14824 Kalmia Ave
- 4617 161st St
- 4617 161st St Unit 2FL
- 4623 161st St
- 4623 161st St Unit 2 Fl
- 4627 161st St
- 4615 161st St
- 4629 161st St
- 4613 161st St
- 46-43 161st St
- 46-13 161st St Unit 1
- 46-13 161st St
- 4622 162nd St
- 46-11 161 St Unit 3
- 46-11 161 St
- 46-11 161st St Unit 3
- 46-11 161st St
- 4624 162nd St
- 4618 162nd St
- 46-18 162nd St
- 4622 162nd St