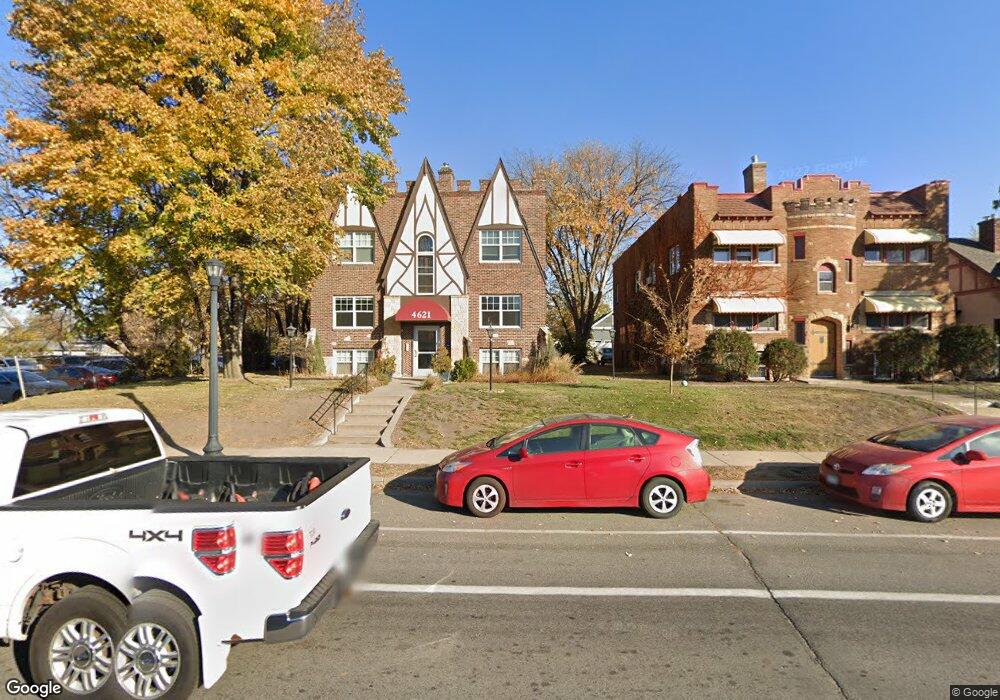
4621 Nicollet Ave Unit 101 Minneapolis, MN 55419
Tangletown NeighborhoodEstimated Value: $191,000 - $204,355
2
Beds
1
Bath
911
Sq Ft
$217/Sq Ft
Est. Value
About This Home
This home is located at 4621 Nicollet Ave Unit 101, Minneapolis, MN 55419 and is currently estimated at $197,589, approximately $216 per square foot. 4621 Nicollet Ave Unit 101 is a home located in Hennepin County with nearby schools including Burroughs Elementary School, Justice Page Middle School, and Washburn High School.
Ownership History
Date
Name
Owned For
Owner Type
Purchase Details
Closed on
Dec 28, 2015
Sold by
Orchard Park Homes Llc
Bought by
4621 Nicollet Llc
Current Estimated Value
Home Financials for this Owner
Home Financials are based on the most recent Mortgage that was taken out on this home.
Original Mortgage
$670,000
Outstanding Balance
$531,616
Interest Rate
3.97%
Estimated Equity
-$334,027
Purchase Details
Closed on
Dec 21, 2015
Home Financials for this Owner
Home Financials are based on the most recent Mortgage that was taken out on this home.
Original Mortgage
$670,000
Outstanding Balance
$531,616
Interest Rate
3.97%
Estimated Equity
-$334,027
Purchase Details
Closed on
Jan 25, 2013
Sold by
Fidelity Bank
Bought by
Orchard Park Homes Llc
Purchase Details
Closed on
Nov 7, 2012
Sold by
Twj Industries Inc
Bought by
Fidelity Bank
Create a Home Valuation Report for This Property
The Home Valuation Report is an in-depth analysis detailing your home's value as well as a comparison with similar homes in the area
Home Values in the Area
Average Home Value in this Area
Purchase History
| Date | Buyer | Sale Price | Title Company |
|---|---|---|---|
| 4621 Nicollet Llc | $660,000 | Guaranty Com Title Inc | |
| -- | $670,000 | -- | |
| Orchard Park Homes Llc | -- | Commercial Partners Title Ll | |
| Fidelity Bank | -- | None Available |
Source: Public Records
Mortgage History
| Date | Status | Borrower | Loan Amount |
|---|---|---|---|
| Open | -- | $670,000 |
Source: Public Records
Tax History Compared to Growth
Tax History
| Year | Tax Paid | Tax Assessment Tax Assessment Total Assessment is a certain percentage of the fair market value that is determined by local assessors to be the total taxable value of land and additions on the property. | Land | Improvement |
|---|---|---|---|---|
| 2024 | $2,781 | $187,000 | $40,000 | $147,000 |
| 2023 | $2,402 | $184,000 | $26,000 | $158,000 |
| 2022 | $2,467 | $178,000 | $24,000 | $154,000 |
| 2021 | $2,160 | $178,000 | $23,000 | $155,000 |
| 2020 | $2,232 | $161,500 | $18,300 | $143,200 |
| 2019 | $2,172 | $154,000 | $18,300 | $135,700 |
| 2018 | $2,043 | $145,500 | $18,300 | $127,200 |
| 2017 | $2,009 | $130,500 | $18,300 | $112,200 |
| 2016 | $2,108 | $125,000 | $18,300 | $106,700 |
| 2015 | $2,273 | $112,000 | $18,300 | $93,700 |
| 2014 | -- | $102,500 | $18,300 | $84,200 |
Source: Public Records
Map
Nearby Homes
- 4625 Nicollet Ave Unit 5
- 4622 1st Ave S
- 14 W 47th St
- 4720 Nicollet Ave
- 4536 Grand Ave S
- 4323 Wentworth Ave
- 4404 Clinton Ave
- 4517 4th Ave S
- 4255 1st Ave S
- 352 E 44th St
- 4405 4th Ave S
- 5014 Nicollet Ave
- 4235 Pillsbury Ave S Unit 23
- 4408 5th Ave S
- 314 E 50th St
- 4625 Lyndale Ave S
- 4904 5th Ave S
- 4201 1st Ave S
- 4408 Garfield Ave
- 4429 Portland Ave
- 4621 Nicollet Ave Unit 202
- 4621 Nicollet Ave Unit 201
- 4621 Nicollet Ave Unit 102
- 4621 Nicollet Ave Unit 1
- 4621 Nicollet Ave
- 4625 Nicollet Ave Unit 4
- 4625 Nicollet Ave Unit 3
- 4625 Nicollet Ave Unit 2
- 4625 Nicollet Ave Unit 1
- 4625 4625 Nicollet Ave
- 4625 4625 Nicollet-Avenue-s
- 4625 4625 Nicollet-Avenue-
- 4627 Nicollet Ave
- 4616 1st Ave S
- 4620 1st Ave S
- 4612 1st Ave S
- 4629 Nicollet Ave
- 4608 1st Ave S
- 4624 1st Ave S
- 4633 Nicollet Ave