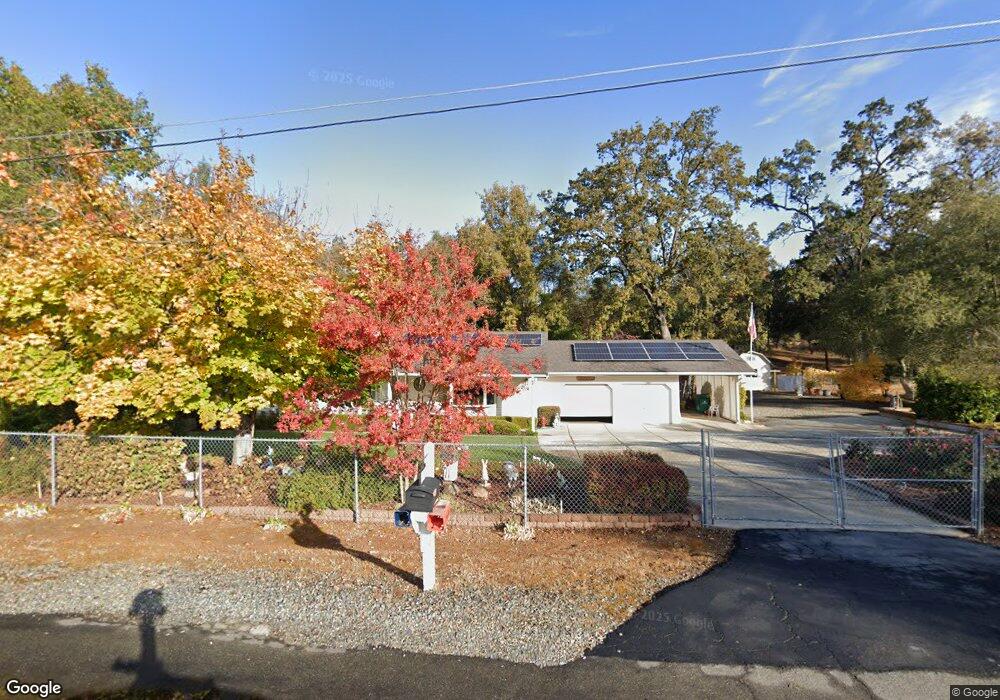
4621 Tulle Ln Shingle Springs, CA 95682
Estimated Value: $523,000 - $673,000
3
Beds
2
Baths
1,882
Sq Ft
$323/Sq Ft
Est. Value
About This Home
This home is located at 4621 Tulle Ln, Shingle Springs, CA 95682 and is currently estimated at $608,305, approximately $323 per square foot. 4621 Tulle Ln is a home located in El Dorado County with nearby schools including Buckeye Elementary School, Camerado Springs Middle School, and Ponderosa High School.
Ownership History
Date
Name
Owned For
Owner Type
Purchase Details
Closed on
Jun 27, 2001
Sold by
Wickham Clyde F and Wickham Lelia J
Bought by
Wickham Clyde F and Wickham Lelia J
Current Estimated Value
Home Financials for this Owner
Home Financials are based on the most recent Mortgage that was taken out on this home.
Original Mortgage
$140,000
Interest Rate
7.15%
Purchase Details
Closed on
May 24, 2001
Sold by
Wickham Clyde F and Wickham Lelia J
Bought by
Wickham Clyde F and Wickham Lelia J
Home Financials for this Owner
Home Financials are based on the most recent Mortgage that was taken out on this home.
Original Mortgage
$140,000
Interest Rate
7.15%
Purchase Details
Closed on
May 16, 1997
Sold by
Wickham Clyde F and Wickham Lelia J
Bought by
Wickham Clyde F and Wickham Lelia J
Purchase Details
Closed on
Mar 11, 1997
Sold by
Romero Alfonso G Tr and Romero Frances D Tr Etal
Bought by
Wickham Clyde F and Wickham Lelia J
Home Financials for this Owner
Home Financials are based on the most recent Mortgage that was taken out on this home.
Original Mortgage
$161,000
Interest Rate
7.5%
Create a Home Valuation Report for This Property
The Home Valuation Report is an in-depth analysis detailing your home's value as well as a comparison with similar homes in the area
Home Values in the Area
Average Home Value in this Area
Purchase History
| Date | Buyer | Sale Price | Title Company |
|---|---|---|---|
| Wickham Clyde F | -- | -- | |
| Wickham Clyde F | -- | Alliance Title Company | |
| Wickham Clyde F | -- | -- | |
| Wickham Clyde F | $230,000 | Chicago Title Co |
Source: Public Records
Mortgage History
| Date | Status | Borrower | Loan Amount |
|---|---|---|---|
| Previous Owner | Wickham Clyde F | $140,000 | |
| Previous Owner | Wickham Clyde F | $161,000 |
Source: Public Records
Tax History Compared to Growth
Tax History
| Year | Tax Paid | Tax Assessment Tax Assessment Total Assessment is a certain percentage of the fair market value that is determined by local assessors to be the total taxable value of land and additions on the property. | Land | Improvement |
|---|---|---|---|---|
| 2025 | $4,160 | $374,560 | $130,275 | $244,285 |
| 2024 | $4,160 | $367,217 | $127,721 | $239,496 |
| 2023 | $4,083 | $360,017 | $125,217 | $234,800 |
| 2022 | $4,025 | $352,959 | $122,762 | $230,197 |
| 2021 | $3,973 | $346,039 | $120,355 | $225,684 |
| 2020 | $3,924 | $342,491 | $119,121 | $223,370 |
| 2019 | $3,866 | $335,777 | $116,786 | $218,991 |
| 2018 | $3,764 | $329,195 | $114,497 | $214,698 |
| 2017 | $3,554 | $322,741 | $112,252 | $210,489 |
| 2016 | $3,503 | $316,413 | $110,051 | $206,362 |
| 2015 | $3,476 | $311,662 | $108,399 | $203,263 |
| 2014 | $3,476 | $305,560 | $106,277 | $199,283 |
Source: Public Records
Map
Nearby Homes
- 4413 Vega Loop
- 4121 Shingle Springs Dr
- 0 Cutty Sark Ln
- 4225 Creekside Dr
- 4231 Idle Creek Dr
- 4370 Hillwood Dr
- 4706 Hillwood Dr
- 4290 Idle Creek Dr
- 4700 Old French Town Rd
- 4700 Old French Town Rd Unit 85
- 4700 Old French Town Rd Unit 94
- 4700 Old French Town Rd Unit 64
- 4700 Old French Town Rd Unit 23
- 4570 Woodside Way
- 3449 N Shingle Rd
- 4101 Panadero Dr
- 4460 Fawn St
- 3790 Ponderosa Rd
- 2021 Solitude Way
- 2 S Shingle Rd
- 4641 Tulle Ln
- 4656 Foothill Dr
- 4601 Tulle Ln
- 4680 Ridge Dr
- 4670 Ridge Dr
- 4650 Foothill Dr
- 4655 Foothill Dr
- 4638 Foothill Dr
- 4636 Ridge Dr
- 4633 Foothill Dr
- 4620 Foothill Dr
- 4620 Ridge Dr
- 4619 Foothill Dr
- 4606 Foothill Dr
- 4603 Foothill Dr
- 4606 Ridge Dr
- Lot 18 Foothill Dr
- 4590 Foothill Dr
- 134 ACS Ridge Dr
- 4589 Foothill Dr