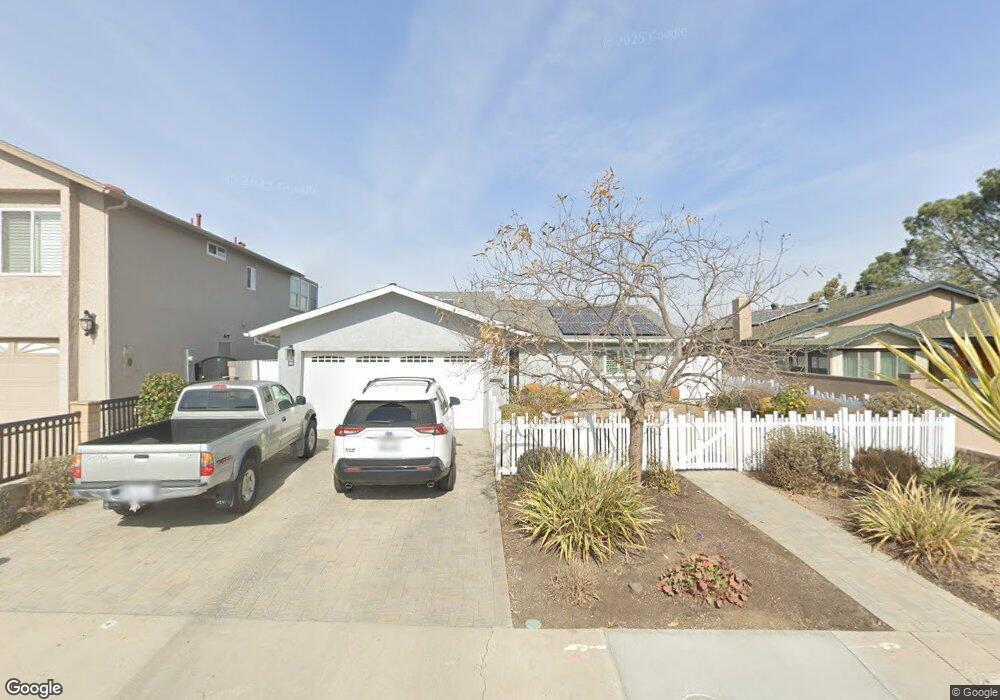
4622 Huggins Way San Diego, CA 92122
University City NeighborhoodEstimated Value: $1,542,938 - $1,747,000
3
Beds
3
Baths
1,911
Sq Ft
$870/Sq Ft
Est. Value
About This Home
This home is located at 4622 Huggins Way, San Diego, CA 92122 and is currently estimated at $1,662,485, approximately $869 per square foot. 4622 Huggins Way is a home located in San Diego County with nearby schools including Marie Curie Elementary School, Standley Middle School, and University City High School.
Ownership History
Date
Name
Owned For
Owner Type
Purchase Details
Closed on
Aug 17, 2021
Sold by
Kalvelage Areaof David and Kalvelage Jennifer C
Bought by
Kalvelage David Thomas and Kalvelage Jennifer C
Current Estimated Value
Purchase Details
Closed on
Apr 15, 2015
Sold by
Iorio Frank G
Bought by
Kalvelage Jennifer C and Kalvelage David
Home Financials for this Owner
Home Financials are based on the most recent Mortgage that was taken out on this home.
Original Mortgage
$35,625
Outstanding Balance
$27,484
Interest Rate
3.64%
Mortgage Type
Credit Line Revolving
Estimated Equity
$1,635,001
Purchase Details
Closed on
Jun 3, 2013
Sold by
Iorio Frank G and Ioria Geraldine L
Bought by
Iorio Frank G
Home Financials for this Owner
Home Financials are based on the most recent Mortgage that was taken out on this home.
Original Mortgage
$165,000
Interest Rate
3.38%
Mortgage Type
New Conventional
Purchase Details
Closed on
Sep 13, 1985
Bought by
Iorio Frank G
Purchase Details
Closed on
Feb 10, 1983
Create a Home Valuation Report for This Property
The Home Valuation Report is an in-depth analysis detailing your home's value as well as a comparison with similar homes in the area
Home Values in the Area
Average Home Value in this Area
Purchase History
| Date | Buyer | Sale Price | Title Company |
|---|---|---|---|
| Kalvelage David Thomas | -- | None Available | |
| Kalvelage Jennifer C | $712,500 | Fidelity National Title | |
| Iorio Frank G | -- | First American Title Company | |
| Iorio Frank G | $135,000 | -- | |
| -- | $105,000 | -- |
Source: Public Records
Mortgage History
| Date | Status | Borrower | Loan Amount |
|---|---|---|---|
| Open | Kalvelage Jennifer C | $35,625 | |
| Previous Owner | Kalvelage Jennifer C | $534,375 | |
| Previous Owner | Iorio Frank G | $165,000 |
Source: Public Records
Tax History Compared to Growth
Tax History
| Year | Tax Paid | Tax Assessment Tax Assessment Total Assessment is a certain percentage of the fair market value that is determined by local assessors to be the total taxable value of land and additions on the property. | Land | Improvement |
|---|---|---|---|---|
| 2025 | $10,259 | $856,307 | $691,059 | $165,248 |
| 2024 | $10,259 | $839,517 | $677,509 | $162,008 |
| 2023 | $10,031 | $823,057 | $664,225 | $158,832 |
| 2022 | $9,763 | $806,919 | $651,201 | $155,718 |
| 2021 | $9,694 | $791,098 | $638,433 | $152,665 |
| 2020 | $9,576 | $782,987 | $631,887 | $151,100 |
| 2019 | $9,404 | $767,636 | $619,498 | $148,138 |
| 2018 | $8,790 | $752,585 | $607,351 | $145,234 |
| 2017 | $81 | $737,830 | $595,443 | $142,387 |
| 2016 | $8,442 | $723,364 | $583,768 | $139,596 |
| 2015 | $3,431 | $289,592 | $95,358 | $194,234 |
| 2014 | $3,378 | $283,921 | $93,491 | $190,430 |
Source: Public Records
Map
Nearby Homes
- 4627 Huggins St
- 7190 Shoreline Dr Unit 6313
- 4635 Pauling Ave
- 7056 Haworth St
- 7160 Shoreline Dr Unit 4213
- 7212 Florey St
- 4282 Robbins St
- 7224 Shoreline Dr Unit 172
- 4612 Benhurst Ave
- 7182 Calabria Ct Unit A
- 4224 Governor Dr
- 7285 Calabria Ct Unit 18
- 7132 Calabria Ct
- 6214 Agee St Unit 34
- 6547 Radcliffe Dr
- 6188 Agee St Unit 230
- 6330 Genesee Ave Unit 319
- 6330 Genesee Ave Unit 220
- 6330 Genesee Ave Unit 119
- 6330 Genesee Ave Unit 112
- 4626 Huggins Way
- 4616 Huggins Way
- 4632 Huggins Way
- 4612 Huggins Way
- 4636 Huggins Way
- 4619 Huggins Way
- 4629 Huggins Way
- 4639 Huggins Way
- 4642 Huggins Way
- 4608 Huggins Way
- 4649 Huggins Way
- 4609 Huggins Way
- 4630 Huggins St
- 4640 Huggins St
- 4646 Huggins Way
- 4620 Huggins St
- 4650 Huggins St
- 4659 Huggins Way
- 4610 Huggins St
- 4660 Huggins St