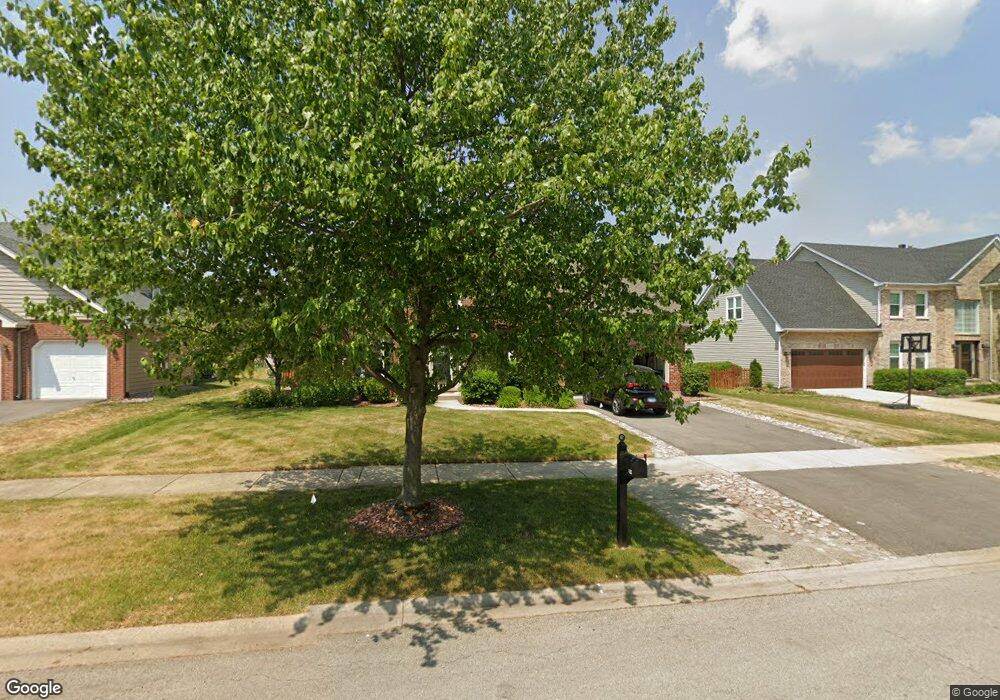
4623 Niswender Ct Naperville, IL 60564
Harmony Grove NeighborhoodEstimated Value: $697,000 - $811,000
--
Bed
1
Bath
2,816
Sq Ft
$266/Sq Ft
Est. Value
About This Home
This home is located at 4623 Niswender Ct, Naperville, IL 60564 and is currently estimated at $748,033, approximately $265 per square foot. 4623 Niswender Ct is a home located in Will County with nearby schools including Oliver Julian Kendall Elementary School, Ellsworth Elementary School, and Clifford Crone Middle School.
Ownership History
Date
Name
Owned For
Owner Type
Purchase Details
Closed on
Oct 30, 1998
Sold by
Archway Bldrs Inc
Bought by
Pater Martin J
Current Estimated Value
Home Financials for this Owner
Home Financials are based on the most recent Mortgage that was taken out on this home.
Original Mortgage
$218,400
Outstanding Balance
$48,217
Interest Rate
6.72%
Estimated Equity
$699,816
Purchase Details
Closed on
May 28, 1997
Sold by
Maf Developments Inc
Bought by
Archw4ay Bldrs Inc
Home Financials for this Owner
Home Financials are based on the most recent Mortgage that was taken out on this home.
Original Mortgage
$52,100
Interest Rate
7.7%
Mortgage Type
Construction
Create a Home Valuation Report for This Property
The Home Valuation Report is an in-depth analysis detailing your home's value as well as a comparison with similar homes in the area
Home Values in the Area
Average Home Value in this Area
Purchase History
| Date | Buyer | Sale Price | Title Company |
|---|---|---|---|
| Pater Martin J | $273,000 | Chicago Title Insurance Co | |
| Archw4ay Bldrs Inc | $69,500 | Chicago Title Insurance Co |
Source: Public Records
Mortgage History
| Date | Status | Borrower | Loan Amount |
|---|---|---|---|
| Open | Pater Martin J | $218,400 | |
| Previous Owner | Archw4ay Bldrs Inc | $52,100 |
Source: Public Records
Tax History Compared to Growth
Tax History
| Year | Tax Paid | Tax Assessment Tax Assessment Total Assessment is a certain percentage of the fair market value that is determined by local assessors to be the total taxable value of land and additions on the property. | Land | Improvement |
|---|---|---|---|---|
| 2024 | $12,401 | $197,337 | $43,748 | $153,589 |
| 2023 | $12,401 | $174,326 | $38,647 | $135,679 |
| 2022 | $11,821 | $159,938 | $36,560 | $123,378 |
| 2021 | $10,658 | $152,322 | $34,819 | $117,503 |
| 2020 | $10,455 | $149,908 | $34,267 | $115,641 |
| 2019 | $10,275 | $145,683 | $33,301 | $112,382 |
| 2018 | $9,669 | $135,080 | $32,568 | $102,512 |
| 2017 | $10,877 | $149,493 | $31,727 | $117,766 |
| 2016 | $10,856 | $146,275 | $31,044 | $115,231 |
| 2015 | $10,765 | $140,649 | $29,850 | $110,799 |
| 2014 | $10,765 | $136,870 | $29,850 | $107,020 |
| 2013 | $10,765 | $136,870 | $29,850 | $107,020 |
Source: Public Records
Map
Nearby Homes
- 2711 Wait Rd
- 11110 Highland Dr
- 26106 W Sherwood Cir
- 23234 W Allagash Dr
- 24024 W Champion Dr
- 11319 Maplewood Dr
- 3740 Ryder Ct
- 2255 Wendt Cir
- 2547 Mallet Ct
- 2543 Mallet Ct
- 2539 Mallet Ct
- 2519 Mallet Ct
- 2611 Lawlor Ln
- 2419 Lawlor Ln
- 2607 Lawlor Ln
- 2423 Lawlor Ln
- 2427 Lawlor Ln
- 11723 Heritage Meadows Dr
- 2547 Tailshot Rd
- 2668 Lawlor Ln
- 4619 Niswender Ct
- 4703 Niswender Dr
- 2847 Fairhauser Ct
- 2851 Fairhauser Ct
- 2843 Fairhauser Ct
- 4707 Niswender Dr Unit 3
- 4615 Niswender Ct
- 2855 Fairhauser Ct
- 2839 Fairhauser Ct
- 4620 Niswender Ct
- 2744 Wait Rd Unit 3
- 4611 Niswender Ct
- 2803 Fairhauser Ct Unit 3
- 2807 Fairhauser Ct Unit 3
- 4616 Niswender Ct
- 2859 Fairhauser Ct
- 2740 Wait Rd Unit 3
- 2815 Fairhauser Ct
- 2735 Wait Rd
- 2743 Fairhauser Rd