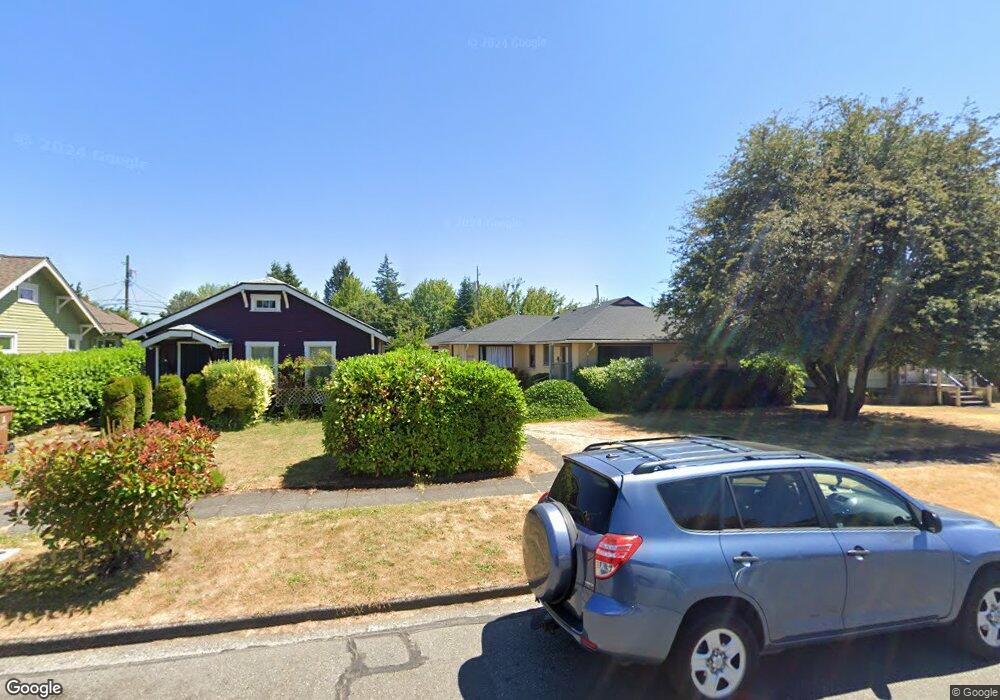
4623 S K St Unit 4625 Tacoma, WA 98408
South End NeighborhoodEstimated Value: $397,000 - $475,000
3
Beds
2
Baths
1,276
Sq Ft
$343/Sq Ft
Est. Value
About This Home
This home is located at 4623 S K St Unit 4625, Tacoma, WA 98408 and is currently estimated at $438,271, approximately $343 per square foot. 4623 S K St Unit 4625 is a home located in Pierce County with nearby schools including Whitman Elementary School, Angelo Giaudrone Middle School, and Lincoln High School.
Ownership History
Date
Name
Owned For
Owner Type
Purchase Details
Closed on
Jun 6, 2025
Sold by
4623-4625 Llc
Bought by
Mma Trust and Armanious
Current Estimated Value
Purchase Details
Closed on
Nov 5, 2015
Sold by
Paul Margaret A
Bought by
4623-4625 Llc
Home Financials for this Owner
Home Financials are based on the most recent Mortgage that was taken out on this home.
Original Mortgage
$80,000
Interest Rate
3.73%
Mortgage Type
Unknown
Purchase Details
Closed on
Mar 23, 2005
Sold by
Mccauley Ruth J
Bought by
Paul Margaret A
Create a Home Valuation Report for This Property
The Home Valuation Report is an in-depth analysis detailing your home's value as well as a comparison with similar homes in the area
Home Values in the Area
Average Home Value in this Area
Purchase History
| Date | Buyer | Sale Price | Title Company |
|---|---|---|---|
| Mma Trust | -- | None Listed On Document | |
| 4623-4625 Llc | $99,719 | Chicago Title | |
| Paul Margaret A | -- | -- |
Source: Public Records
Mortgage History
| Date | Status | Borrower | Loan Amount |
|---|---|---|---|
| Previous Owner | 4623-4625 Llc | $80,000 |
Source: Public Records
Tax History Compared to Growth
Tax History
| Year | Tax Paid | Tax Assessment Tax Assessment Total Assessment is a certain percentage of the fair market value that is determined by local assessors to be the total taxable value of land and additions on the property. | Land | Improvement |
|---|---|---|---|---|
| 2025 | $3,963 | $408,100 | $209,800 | $198,300 |
| 2024 | $3,963 | $404,800 | $202,700 | $202,100 |
| 2023 | $3,963 | $355,700 | $190,400 | $165,300 |
| 2022 | $3,809 | $398,600 | $187,200 | $211,400 |
| 2021 | $3,389 | $269,400 | $107,900 | $161,500 |
| 2019 | $2,700 | $236,100 | $94,000 | $142,100 |
| 2018 | $2,889 | $207,500 | $81,800 | $125,700 |
| 2017 | $2,459 | $182,700 | $59,600 | $123,100 |
| 2016 | $1,309 | $148,200 | $43,500 | $104,700 |
| 2014 | $1,088 | $140,300 | $42,300 | $98,000 |
| 2013 | $1,088 | $130,200 | $38,700 | $91,500 |
Source: Public Records
Map
Nearby Homes