Estimated Value: $265,000 - $296,184
3
Beds
2
Baths
1,280
Sq Ft
$217/Sq Ft
Est. Value
About This Home
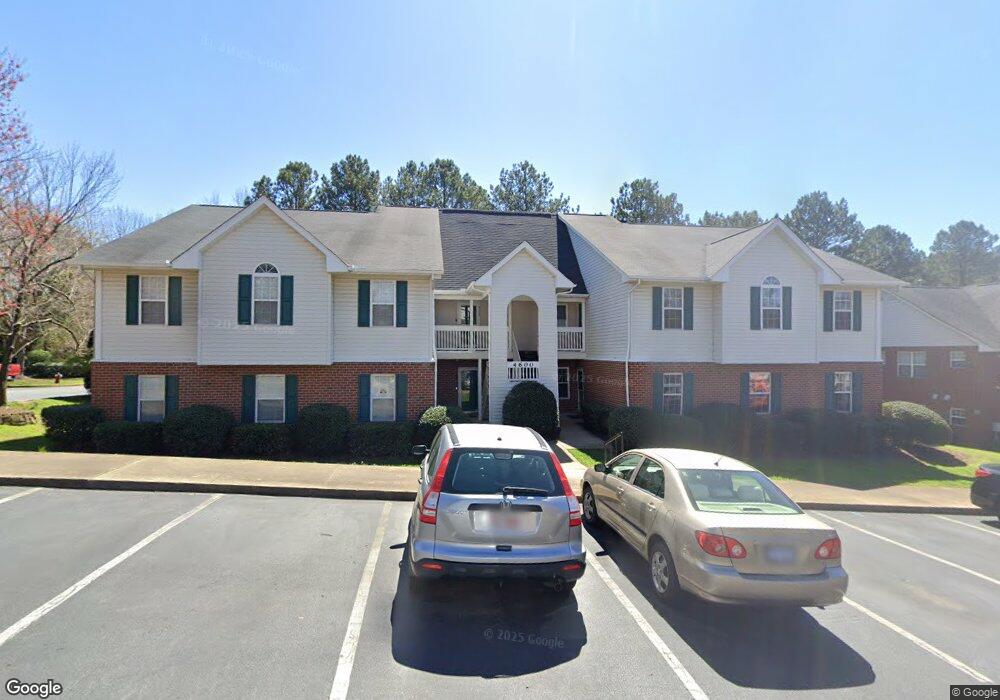
This home is located at 4623 Wellington Ridge Loop, Cary, NC 27518 and is currently estimated at $277,546, approximately $216 per square foot. 4623 Wellington Ridge Loop is a home located in Wake County with nearby schools including Dillard Drive Magnet Elementary School, Dillard Drive Magnet Middle School, and Resurrection Lutheran School.
Ownership History
Date
Name
Owned For
Owner Type
Purchase Details
Closed on
Sep 15, 2005
Sold by
Inman David D and Inman Joanna
Bought by
Catullo Pasquale B
Current Estimated Value
Home Financials for this Owner
Home Financials are based on the most recent Mortgage that was taken out on this home.
Original Mortgage
$87,600
Outstanding Balance
$46,630
Interest Rate
5.77%
Mortgage Type
Fannie Mae Freddie Mac
Estimated Equity
$230,916
Purchase Details
Closed on
May 27, 1999
Sold by
Crabtree Ella P
Bought by
Inman David D
Home Financials for this Owner
Home Financials are based on the most recent Mortgage that was taken out on this home.
Original Mortgage
$111,500
Interest Rate
6.84%
Purchase Details
Closed on
Nov 25, 1997
Sold by
Bill Clark Homes Of Raleigh Llc
Bought by
Crabtree Ella P
Home Financials for this Owner
Home Financials are based on the most recent Mortgage that was taken out on this home.
Original Mortgage
$66,850
Interest Rate
7.35%
Create a Home Valuation Report for This Property
The Home Valuation Report is an in-depth analysis detailing your home's value as well as a comparison with similar homes in the area
Home Values in the Area
Average Home Value in this Area
Purchase History
| Date | Buyer | Sale Price | Title Company |
|---|---|---|---|
| Catullo Pasquale B | $109,500 | None Available | |
| Inman David D | $109,000 | -- | |
| Crabtree Ella P | $111,500 | -- |
Source: Public Records
Mortgage History
| Date | Status | Borrower | Loan Amount |
|---|---|---|---|
| Open | Catullo Pasquale B | $87,600 | |
| Previous Owner | Inman David D | $111,500 | |
| Previous Owner | Crabtree Ella P | $66,850 |
Source: Public Records
Tax History Compared to Growth
Tax History
| Year | Tax Paid | Tax Assessment Tax Assessment Total Assessment is a certain percentage of the fair market value that is determined by local assessors to be the total taxable value of land and additions on the property. | Land | Improvement |
|---|---|---|---|---|
| 2025 | $2,350 | $271,871 | -- | $271,871 |
| 2024 | $2,300 | $271,871 | $0 | $271,871 |
| 2023 | $1,856 | $183,196 | $0 | $183,196 |
| 2022 | $1,787 | $183,196 | $0 | $183,196 |
| 2021 | $1,751 | $183,196 | $0 | $183,196 |
| 2020 | $1,760 | $183,196 | $0 | $183,196 |
| 2019 | $1,367 | $125,845 | $0 | $125,845 |
| 2018 | $1,284 | $125,845 | $0 | $125,845 |
| 2017 | $1,234 | $125,845 | $0 | $125,845 |
| 2016 | $1,216 | $125,845 | $0 | $125,845 |
| 2015 | $1,200 | $119,899 | $0 | $119,899 |
| 2014 | $1,133 | $119,899 | $0 | $119,899 |
Source: Public Records
Map
Nearby Homes
- 4311 Wellington Ridge Loop
- 1221 Renshaw Ct
- 304 W Kirkfield Dr
- 1641 Kildonan Place
- 2414 Stephens Rd
- 1640 Glengarry Dr
- 0 SE Cary Pkwy Unit 2491180
- 311 Dunhagan Place
- 307 Durington Place
- 301 Dunhagan Place
- 104 Catherwood Place
- 6315 Tryon Rd
- 2434 Stephens Rd
- 1331 Kingston Ridge Rd
- 105 Headlands Ln
- 105 Crosswaite Way
- 109 Beaver Pine Way
- 121 Bay Dr
- 1404 Rock Creek Ln
- 2015 Piney Plains Rd
- 4622 Wellington Ridge Loop
- 4612 Wellington Ridge Loop
- 4622 Wellington Ridge Loop
- 2522 Wellington Ridge Loop
- 2513 Wellington Ridge Loop
- 2522 Wellington Ridge Loop
- 2522 Wellington Ridge Loop Unit 2522
- 2522 Wellington Ridge Loop
- 2522 Wellington Ridge Loop
- 4611 Wellington Ridge Loop
- 4613 Wellington Ridge Loop
- 4621 Wellington Ridge Loop
- 2411 Wellington Ridge Loop
- 2411 Wellington Ridge Loop Unit 2411
- 2411 Wellington Ridge Loop Unit 1
- 2421 Wellington Ridge Loop
- 2423 Wellington Ridge Loop
- 4413 Wellington Ridge Loop
- 4413 Wellington Ridge Loop Unit 13
- 2511 Wellington Ridge Loop