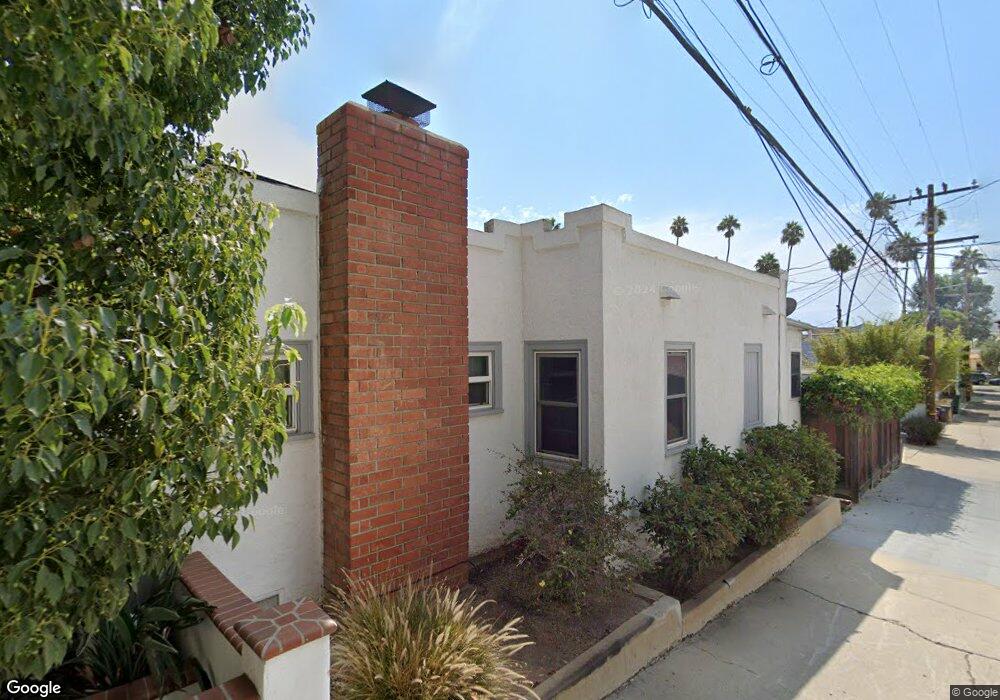
4624 E Shaw St Long Beach, CA 90803
Belmont Heights NeighborhoodEstimated Value: $1,199,407 - $1,394,000
2
Beds
2
Baths
1,076
Sq Ft
$1,241/Sq Ft
Est. Value
About This Home
This home is located at 4624 E Shaw St, Long Beach, CA 90803 and is currently estimated at $1,335,852, approximately $1,241 per square foot. 4624 E Shaw St is a home located in Los Angeles County with nearby schools including Lowell Elementary School, Rogers Middle School, and Woodrow Wilson High School.
Ownership History
Date
Name
Owned For
Owner Type
Purchase Details
Closed on
Apr 4, 2015
Sold by
Hassan Reep Omar and Decator Rachel
Bought by
Reep Fatima Junaidi and The Reep Family Inter Vivos Tr
Current Estimated Value
Purchase Details
Closed on
Mar 29, 2007
Sold by
Laplante Roderick E and Pepper Ann M
Bought by
Hassan Reep Omar and Decator Rachel
Home Financials for this Owner
Home Financials are based on the most recent Mortgage that was taken out on this home.
Original Mortgage
$552,500
Interest Rate
5.75%
Mortgage Type
Purchase Money Mortgage
Purchase Details
Closed on
Feb 22, 1994
Sold by
Scott Alice
Bought by
Laplante Roderick E and Pepper Ann M
Home Financials for this Owner
Home Financials are based on the most recent Mortgage that was taken out on this home.
Original Mortgage
$160,000
Interest Rate
7.38%
Create a Home Valuation Report for This Property
The Home Valuation Report is an in-depth analysis detailing your home's value as well as a comparison with similar homes in the area
Home Values in the Area
Average Home Value in this Area
Purchase History
| Date | Buyer | Sale Price | Title Company |
|---|---|---|---|
| Reep Fatima Junaidi | $805,000 | None Available | |
| Hassan Reep Omar | $840,000 | Financial Title Company | |
| Laplante Roderick E | $200,000 | North American Title Company |
Source: Public Records
Mortgage History
| Date | Status | Borrower | Loan Amount |
|---|---|---|---|
| Previous Owner | Hassan Reep Omar | $552,500 | |
| Previous Owner | Laplante Roderick E | $160,000 |
Source: Public Records
Tax History
| Year | Tax Paid | Tax Assessment Tax Assessment Total Assessment is a certain percentage of the fair market value that is determined by local assessors to be the total taxable value of land and additions on the property. | Land | Improvement |
|---|---|---|---|---|
| 2025 | $12,136 | $967,479 | $773,985 | $193,494 |
| 2024 | $12,136 | $948,509 | $758,809 | $189,700 |
| 2023 | $11,934 | $929,912 | $743,931 | $185,981 |
| 2022 | $11,194 | $911,680 | $729,345 | $182,335 |
| 2021 | $10,982 | $893,805 | $715,045 | $178,760 |
| 2019 | $10,826 | $867,297 | $693,838 | $173,459 |
| 2018 | $10,532 | $850,292 | $680,234 | $170,058 |
| 2016 | $9,694 | $817,276 | $653,821 | $163,455 |
| 2015 | $8,780 | $759,000 | $607,200 | $151,800 |
| 2014 | $8,880 | $759,000 | $607,200 | $151,800 |
Source: Public Records
Map
Nearby Homes
- 4527 E Shaw St
- 219 Ximeno Ave
- 4401 E Division St
- 150 Saint Joseph Ave
- 140 Saint Joseph Ave
- 118 Roycroft Ave
- 280 Park Ave
- 111 Ximeno Ave
- 153 Granada Ave
- 260 Prospect Ave
- 104 Saint Joseph Ave
- 132 Belmont Ave
- 105 Roswell Ave
- 5120 E Livingston Dr
- 237 Covina Ave
- 74 Argonne Ave
- 267 Nieto Ave
- 75 Granada Ave
- 224 Covina Ave
- 116 Termino Ave
- 4616 E Shaw St
- 211 Roycroft Ave
- 209 Roycroft Ave
- 207 Roycroft Ave
- 208 Quincy Ave
- 210 Quincy Ave
- 206 Quincy Ave
- 4623 E Livingston Dr
- 213 Roycroft Ave
- 4635 E Livingston Dr
- 4625 E Shaw St
- 204 Quincy Ave
- 212 Quincy Ave Unit 405
- 212 Quincy Ave
- 212 Quincy Ave
- 210 Roycroft Ave
- 4619 E Livingston Dr
- 215 Roycroft Ave
- 206 Roycroft Ave
- 4617 E Livingston Dr
Your Personal Tour Guide
Ask me questions while you tour the home.