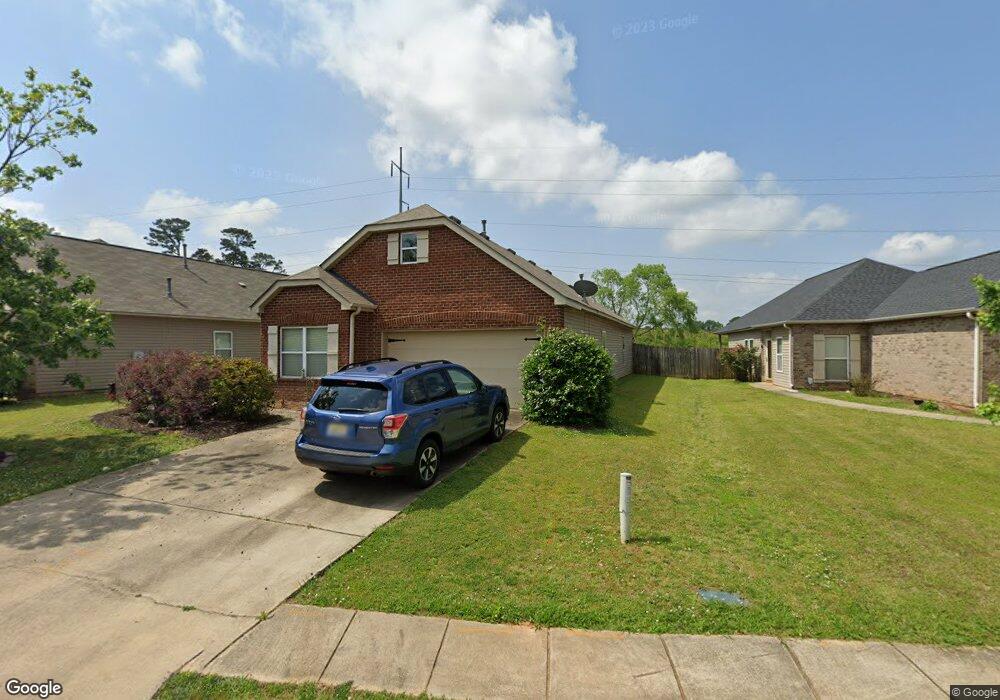
4624 Rosser Loop Dr Unit 95 Bessemer, AL 35022
Estimated Value: $242,000 - $259,000
3
Beds
2
Baths
1,469
Sq Ft
$172/Sq Ft
Est. Value
About This Home
This home is located at 4624 Rosser Loop Dr Unit 95, Bessemer, AL 35022 and is currently estimated at $252,333, approximately $171 per square foot. 4624 Rosser Loop Dr Unit 95 is a home located in Jefferson County with nearby schools including Mcadory Elementary School, Mcadory Middle School, and Mcadory High School.
Ownership History
Date
Name
Owned For
Owner Type
Purchase Details
Closed on
Apr 9, 2025
Sold by
Home Sfr Borrower Iii Llc
Bought by
Pr Borrower 26 Llc
Current Estimated Value
Purchase Details
Closed on
Jun 23, 2017
Sold by
Trans Am Sfe Ii Llc
Bought by
Home Sfr Borrower Iii Llc and C/O Altisource Asset Managemen
Purchase Details
Closed on
Nov 1, 2016
Sold by
Miller Stacie R
Bought by
Trans Am Sfe Ii Llc
Purchase Details
Closed on
Mar 28, 2013
Sold by
Bickley Jonathan
Bought by
Miller Stacie R
Home Financials for this Owner
Home Financials are based on the most recent Mortgage that was taken out on this home.
Original Mortgage
$132,554
Interest Rate
3.62%
Mortgage Type
FHA
Purchase Details
Closed on
Jun 30, 2009
Sold by
D R Horton Inc Birmingham
Bought by
Bickley Jonathan
Home Financials for this Owner
Home Financials are based on the most recent Mortgage that was taken out on this home.
Original Mortgage
$125,700
Interest Rate
4.88%
Mortgage Type
New Conventional
Create a Home Valuation Report for This Property
The Home Valuation Report is an in-depth analysis detailing your home's value as well as a comparison with similar homes in the area
Home Values in the Area
Average Home Value in this Area
Purchase History
We collect this data history from publicly available records. To have your information removed, we recommend requesting removal directly through your county’s website.
| Date | Buyer | Sale Price | Title Company |
|---|---|---|---|
| Pr Borrower 26 Llc | $6,815,500 | -- | |
| Home Sfr Borrower Iii Llc | $1,467,507 | -- | |
| Trans Am Sfe Ii Llc | $144,000 | -- | |
| Miller Stacie R | $135,000 | -- | |
| Bickley Jonathan | $157,125 | None Available |
Source: Public Records
Mortgage History
We collect this data history from publicly available records. To have your information removed, we recommend requesting removal directly through your county’s website.
| Date | Status | Borrower | Loan Amount |
|---|---|---|---|
| Previous Owner | Miller Stacie R | $132,554 | |
| Previous Owner | Bickley Jonathan | $125,700 |
Source: Public Records
Tax History
| Year | Tax Paid | Tax Assessment Tax Assessment Total Assessment is a certain percentage of the fair market value that is determined by local assessors to be the total taxable value of land and additions on the property. | Land | Improvement |
|---|---|---|---|---|
| 2025 | $2,567 | $50,440 | -- | -- |
| 2024 | $2,448 | $51,640 | -- | -- |
| 2022 | $2,123 | $42,380 | $9,600 | $32,780 |
| 2021 | $1,825 | $36,420 | $9,600 | $26,820 |
| 2020 | $2,023 | $33,660 | $9,600 | $24,060 |
| 2019 | $1,629 | $32,520 | $0 | $0 |
| 2018 | $1,555 | $31,040 | $0 | $0 |
| 2017 | $675 | $14,540 | $0 | $0 |
| 2016 | $681 | $14,660 | $0 | $0 |
| 2015 | $651 | $14,060 | $0 | $0 |
| 2014 | $811 | $14,300 | $0 | $0 |
| 2013 | $811 | $14,300 | $0 | $0 |
Source: Public Records
Map
Nearby Homes
- 4555 Rosser Loop Dr
- 5703 Cedar Creek Park Dr
- 1751 Bradford Ln
- 1721 Bradford Ln
- 1628 Eastern Valley Rd
- 1805 Brandon Way
- 4623 Rosser Farms Pkwy
- 5091 Meadow Ridge Trail
- 294 McCalla Rd
- 334 McCalla Rd
- 4775 Carriage Dr
- 4642 Rosser Farms Pkwy
- 4774 Carriage Dr
- 5216 Meadow Ridge Trail
- 5249 Meadow Ridge Trail
- 4770 Bayleaf Ln
- 5805 Bayleaf Ln
- 5801 Bayleaf Ln
- 5257 Meadow Ridge Trail
- 5785 Bayleaf Ln
- 4624 Rosser Loop Dr
- 4624 Rosser Loop Dr
- 4620 Rosser Loop Dr
- 4620 Rosser Loop Dr Unit 94
- 4620 Rosser Loop Dr Unit 94
- 4628 Rosser Loop Dr
- 4628 Rosser Loop Dr Unit 96
- 4632 Rosser Loop Dr
- 4632 Rosser Loop Dr Unit 181
- 4632 Rosser Loop Dr Unit 97
- 4616 Rosser Loop Dr
- 4616 Rosser Loop Dr Unit 93
- 4636 Rosser Loop Dr
- 4636 Rosser Loop Dr
- 4636 Rosser Loop Dr Unit 98
- 4612 Rosser Loop Dr
- 4612 Rosser Loop Dr Unit 92
- 4612 Rosser Loop Dr
- 4608 Rosser Loop Dr
- 4640 Rosser Loop Dr
Your Personal Tour Guide
Ask me questions while you tour the home.