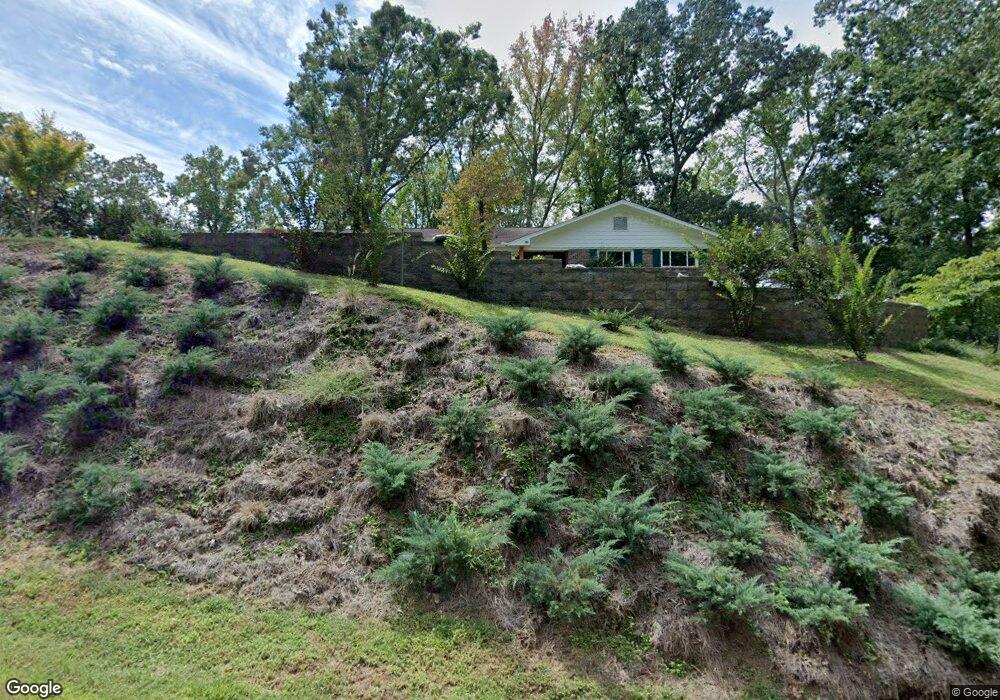
4625 Shoreline Ln Unit 7 & 8 Gainesville, GA 30506
Estimated Value: $1,020,000 - $1,126,000
4
Beds
2
Baths
1,789
Sq Ft
$599/Sq Ft
Est. Value
About This Home
This home is located at 4625 Shoreline Ln Unit 7 & 8, Gainesville, GA 30506 and is currently estimated at $1,071,901, approximately $599 per square foot. 4625 Shoreline Ln Unit 7 & 8 is a home located in Hall County with nearby schools including Elbert Elementary School, Mount Vernon Elementary School, and North Hall Middle School.
Ownership History
Date
Name
Owned For
Owner Type
Purchase Details
Closed on
Aug 31, 2023
Sold by
Wetherton James D
Bought by
Travis Angela
Current Estimated Value
Home Financials for this Owner
Home Financials are based on the most recent Mortgage that was taken out on this home.
Original Mortgage
$525,000
Outstanding Balance
$513,740
Interest Rate
6.9%
Mortgage Type
New Conventional
Estimated Equity
$558,161
Purchase Details
Closed on
May 3, 2017
Sold by
Traikovich James
Bought by
Wetherton James D and Wetherton Mary Elisa
Purchase Details
Closed on
Jun 20, 2013
Sold by
Dacosta Janet S
Bought by
Traikovich James and Traikovich Kelly
Purchase Details
Closed on
May 17, 2007
Sold by
Scarbrough Joseph
Bought by
Scarbrough Jean C
Create a Home Valuation Report for This Property
The Home Valuation Report is an in-depth analysis detailing your home's value as well as a comparison with similar homes in the area
Home Values in the Area
Average Home Value in this Area
Purchase History
| Date | Buyer | Sale Price | Title Company |
|---|---|---|---|
| Travis Angela | $925,000 | -- | |
| Wetherton James D | $330,000 | -- | |
| Traikovich James | -- | -- | |
| Traikovich James | -- | -- | |
| Traikovich James | -- | -- | |
| Traikovich James | -- | -- | |
| Traikovich James | -- | -- | |
| Traikovich James | $172,000 | -- | |
| Scarbrough Jean C | -- | -- |
Source: Public Records
Mortgage History
| Date | Status | Borrower | Loan Amount |
|---|---|---|---|
| Open | Travis Angela | $525,000 |
Source: Public Records
Tax History Compared to Growth
Tax History
| Year | Tax Paid | Tax Assessment Tax Assessment Total Assessment is a certain percentage of the fair market value that is determined by local assessors to be the total taxable value of land and additions on the property. | Land | Improvement |
|---|---|---|---|---|
| 2024 | $9,133 | $367,160 | $197,800 | $169,360 |
| 2023 | $1,331 | $174,040 | $62,080 | $111,960 |
| 2022 | $1,377 | $153,080 | $62,080 | $91,000 |
| 2021 | $1,405 | $148,160 | $62,080 | $86,080 |
| 2020 | $1,402 | $144,480 | $62,080 | $82,400 |
| 2019 | $3,311 | $139,560 | $62,080 | $77,480 |
| 2018 | $3,205 | $133,920 | $58,000 | $75,920 |
| 2017 | $2,824 | $98,720 | $52,120 | $46,600 |
| 2016 | $2,757 | $98,720 | $52,120 | $46,600 |
| 2015 | $1,992 | $98,920 | $52,320 | $46,600 |
| 2014 | $1,992 | $98,920 | $52,320 | $46,600 |
Source: Public Records
Map
Nearby Homes
- 4637 Shoreline Ln
- 4536 Shoreline Dr
- 4453 Harold Whelchel Rd
- 4979 Letha Dr
- 4450 Roberta Cir
- 4532 Wahoo Dr
- 4486 Old Magnolia Ct
- 4301 Harold Whelchel Rd
- 4467 Tall Hickory Trail
- 4243 Perry Dr
- 4227 Harold Whelchel Rd
- 4315 Post Oak Point
- 4181 Perry Dr
- 4618 Seminole Dr
- 4823 Hiawatha Dr
- 4785 Hiawatha Dr
- 4959 Rilla Rd
- 4625 Shoreline Ln
- 0 Shoreline Ln Unit 7351225
- 0 Shoreline Ln
- 4643 Shoreline Ln
- 4649 Shoreline Ln
- 4551 Shoreline Dr
- 4653 Shoreline Ln
- 4539 Shoreline Dr
- 4550 Shoreline Dr
- 4531 Shoreline Dr
- 4525 Shoreline Dr
- 4521 Shoreline Dr
- 4774 Buckhorn Cir
- 4626 Shoreline Dr
- 4633 Shoreline Dr
- 4513 Shoreline Dr
- 4505 Shoreline Dr
- 4500 Shoreline Dr
- 0 Shoreline Dr Unit 8669877