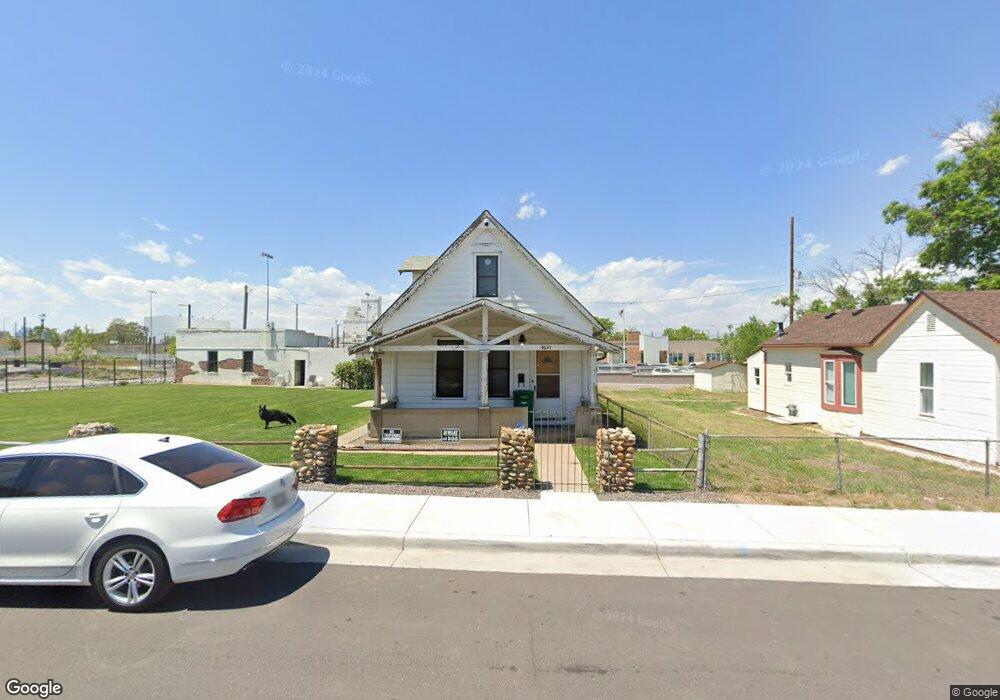
4625 Thompson Ct Denver, CO 80216
Elyria-Swansea NeighborhoodEstimated Value: $397,499 - $468,000
3
Beds
1
Bath
1,801
Sq Ft
$240/Sq Ft
Est. Value
About This Home
This home is located at 4625 Thompson Ct, Denver, CO 80216 and is currently estimated at $431,875, approximately $239 per square foot. 4625 Thompson Ct is a home located in Denver County with nearby schools including Swansea Elementary School, Whittier ECE-8 School, and Bruce Randolph School.
Ownership History
Date
Name
Owned For
Owner Type
Purchase Details
Closed on
Dec 21, 2010
Sold by
Davis Lucille A
Bought by
Portales Jeff
Current Estimated Value
Home Financials for this Owner
Home Financials are based on the most recent Mortgage that was taken out on this home.
Original Mortgage
$104,500
Outstanding Balance
$67,816
Interest Rate
4.18%
Mortgage Type
New Conventional
Estimated Equity
$364,059
Create a Home Valuation Report for This Property
The Home Valuation Report is an in-depth analysis detailing your home's value as well as a comparison with similar homes in the area
Home Values in the Area
Average Home Value in this Area
Purchase History
| Date | Buyer | Sale Price | Title Company |
|---|---|---|---|
| Portales Jeff | $110,000 | None Available |
Source: Public Records
Mortgage History
| Date | Status | Borrower | Loan Amount |
|---|---|---|---|
| Open | Portales Jeff | $104,500 |
Source: Public Records
Tax History
| Year | Tax Paid | Tax Assessment Tax Assessment Total Assessment is a certain percentage of the fair market value that is determined by local assessors to be the total taxable value of land and additions on the property. | Land | Improvement |
|---|---|---|---|---|
| 2025 | $2,121 | $33,170 | $11,250 | $11,250 |
| 2024 | $2,121 | $26,780 | $7,010 | $19,770 |
| 2023 | $2,075 | $26,780 | $7,010 | $19,770 |
| 2022 | $2,026 | $25,480 | $11,090 | $14,390 |
| 2021 | $1,956 | $26,220 | $11,410 | $14,810 |
| 2020 | $2,233 | $30,090 | $7,610 | $22,480 |
| 2019 | $2,170 | $30,090 | $7,610 | $22,480 |
| 2018 | $1,151 | $14,880 | $3,830 | $11,050 |
| 2017 | $1,148 | $14,880 | $3,830 | $11,050 |
| 2016 | $1,029 | $12,620 | $3,391 | $9,229 |
| 2015 | $986 | $12,620 | $3,391 | $9,229 |
| 2014 | $667 | $8,030 | $2,022 | $6,008 |
Source: Public Records
Map
Nearby Homes
- 4648 Josephine St
- 4523 Fillmore St
- 4785 Fillmore St
- 4807 Clayton St
- 4442 Fillmore St
- 4780 Milwaukee St
- 4430 Columbine St
- 4415 Milwaukee St
- 4705 Claude Ct
- 4665 Gaylord St
- 4736 Vine St
- 4341 Steele St
- 4768 Vine St
- 4774 Vine St
- 4933 Steele St
- 4790 Vine St
- 4329 Steele St
- 4430 Adams St
- 4955 Steele St
- 4741 Race St
- 4631 Thompson Ct
- 4667 Thompson Ct
- 4661 Clayton St
- 4671 Thompson Ct
- 4651 Clayton St
- 4641 Clayton St
- 4671 Clayton St
- 4631 Clayton St
- 4685 Thompson Ct
- 4675 Thompson Ct Unit 4685
- 4621 Clayton St
- 4681 Clayton St
- 4695 Thompson Ct
- 4685 Clayton St
- 4611 Clayton St
- 4691 Clayton St
- 4650 Clayton St
- 4664 Clayton St
- 4640 Clayton St
- 4601 Clayton St
Your Personal Tour Guide
Ask me questions while you tour the home.