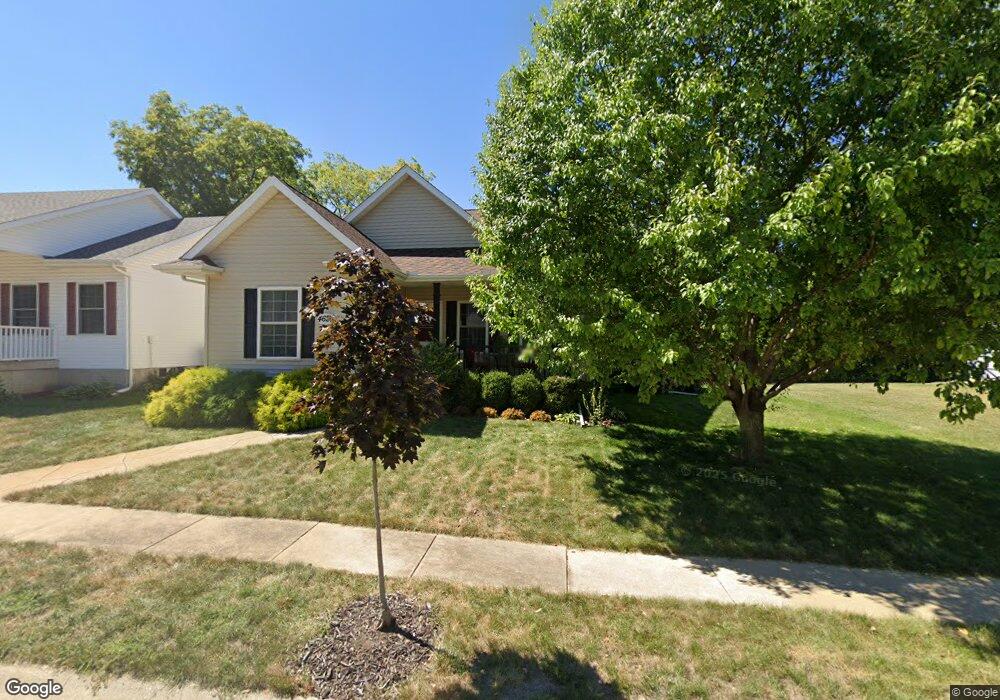
4626 Kelling St Davenport, IA 52806
North Side NeighborhoodEstimated Value: $256,587 - $290,000
4
Beds
2
Baths
1,204
Sq Ft
$230/Sq Ft
Est. Value
About This Home
This home is located at 4626 Kelling St, Davenport, IA 52806 and is currently estimated at $276,397, approximately $229 per square foot. 4626 Kelling St is a home located in Scott County with nearby schools including Martin Luther King Jr. Elementary School, Buchanan Elementary School, and Cumberland Hall School.
Ownership History
Date
Name
Owned For
Owner Type
Purchase Details
Closed on
Sep 30, 2010
Sold by
Jackson John E and Jackson Jana R
Bought by
Carr James M and Wilson Carr Patricia A
Current Estimated Value
Purchase Details
Closed on
May 5, 2008
Sold by
Thompson Orville J and Thompson Linda L
Bought by
Jackson John E and Jackson Jana R
Home Financials for this Owner
Home Financials are based on the most recent Mortgage that was taken out on this home.
Original Mortgage
$102,515
Interest Rate
5.88%
Mortgage Type
Purchase Money Mortgage
Create a Home Valuation Report for This Property
The Home Valuation Report is an in-depth analysis detailing your home's value as well as a comparison with similar homes in the area
Home Values in the Area
Average Home Value in this Area
Purchase History
| Date | Buyer | Sale Price | Title Company |
|---|---|---|---|
| Carr James M | $164,000 | None Available | |
| Jackson John E | $154,500 | None Available |
Source: Public Records
Mortgage History
| Date | Status | Borrower | Loan Amount |
|---|---|---|---|
| Previous Owner | Jackson John E | $102,515 |
Source: Public Records
Tax History Compared to Growth
Tax History
| Year | Tax Paid | Tax Assessment Tax Assessment Total Assessment is a certain percentage of the fair market value that is determined by local assessors to be the total taxable value of land and additions on the property. | Land | Improvement |
|---|---|---|---|---|
| 2025 | $3,736 | $269,410 | $31,100 | $238,310 |
| 2024 | $3,758 | $232,930 | $31,100 | $201,830 |
| 2023 | $4,194 | $232,930 | $31,100 | $201,830 |
| 2022 | $3,938 | $205,190 | $28,700 | $176,490 |
| 2021 | $3,938 | $192,470 | $28,700 | $163,770 |
| 2020 | $3,818 | $184,520 | $28,700 | $155,820 |
| 2019 | $3,962 | $176,570 | $28,700 | $147,870 |
| 2018 | $3,774 | $176,570 | $28,700 | $147,870 |
| 2017 | $3,712 | $171,800 | $28,700 | $143,100 |
| 2016 | $3,572 | $171,800 | $0 | $0 |
| 2015 | $3,572 | $161,920 | $0 | $0 |
| 2014 | $3,402 | $161,920 | $0 | $0 |
| 2013 | $3,340 | $0 | $0 | $0 |
| 2012 | -- | $157,590 | $27,510 | $130,080 |
Source: Public Records
Map
Nearby Homes
- 28 W Village Cir
- 4406 Regency Place
- 2127 W 51st St
- 5109 N Pine St
- 4132 Rodeo Rd
- 2426 W 44th St
- 5210 N Division St
- 4123 N Linwood Ave
- 4705 N Sturdevant St
- 1729 Welshire Dr
- 4104 N Linwood Ave
- 1927 W 55th St
- 4618 Fillmore Ln
- 5436 N Division St
- 5312 Hillandale Rd
- 1453 W 41st St
- 5510 N Division St
- 2620 W 54th St
- 2724 W 38th Place
- 3812 N Thornwood Ave
- 4620 Kelling St
- 4638 Kelling St
- 4642 Kelling St
- 4625 Kelling St
- 4621 Kelling St
- 4633 Kelling St
- 4617 Kelling St
- 4606 Kelling St
- 4650 Kelling St
- 2 W Village Cir
- 4587 Cheyenne Ave
- 4600 Kelling St
- 4605 Kelling St
- 4 W Village Cir
- 4601 Kelling St
- LOT 7 W Village Cir
- 4609 Cheyenne Ave
- 45 W Village Cir
- 42 W Village Cir
- 4706 El Rancho Dr