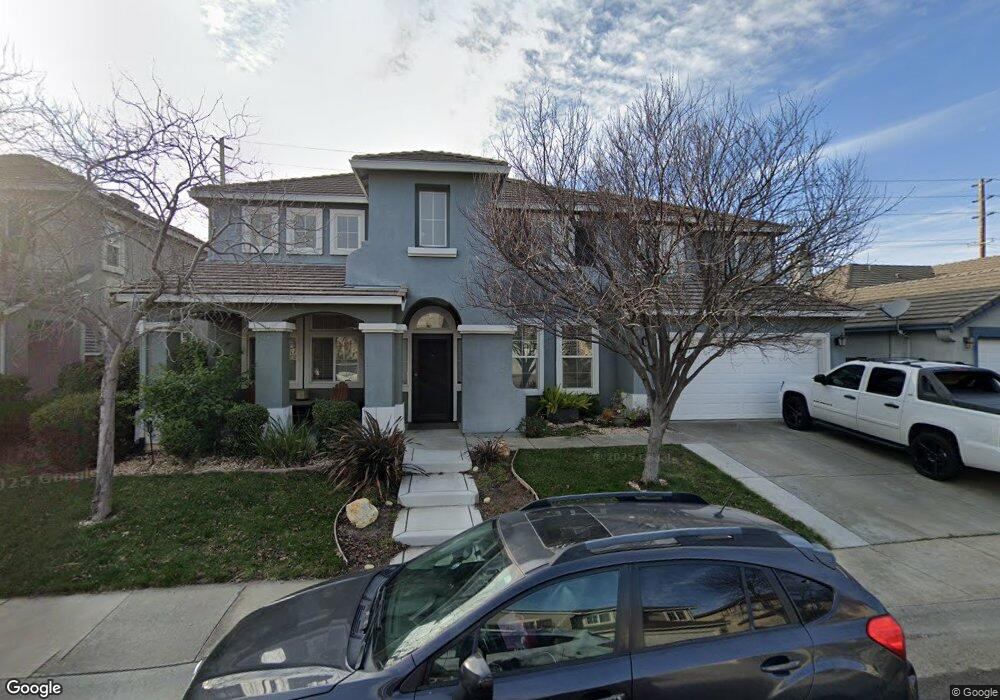
4626 Windsong St Sacramento, CA 95834
Sundance Lake NeighborhoodEstimated Value: $529,000 - $760,000
5
Beds
3
Baths
2,873
Sq Ft
$231/Sq Ft
Est. Value
About This Home
This home is located at 4626 Windsong St, Sacramento, CA 95834 and is currently estimated at $664,820, approximately $231 per square foot. 4626 Windsong St is a home located in Sacramento County with nearby schools including Paso Verde, Inderkum High School, and Natomas Pacific Pathways Prep.
Ownership History
Date
Name
Owned For
Owner Type
Purchase Details
Closed on
May 6, 2024
Sold by
Price Ryan A and Price Andrea M
Bought by
Price Family Trust and Price
Current Estimated Value
Purchase Details
Closed on
Apr 30, 2003
Sold by
Price Ryan
Bought by
Price Ryan and Price Andrea
Home Financials for this Owner
Home Financials are based on the most recent Mortgage that was taken out on this home.
Original Mortgage
$284,900
Interest Rate
4.37%
Purchase Details
Closed on
Sep 5, 2001
Sold by
White Andrea
Bought by
Price Ryan
Home Financials for this Owner
Home Financials are based on the most recent Mortgage that was taken out on this home.
Original Mortgage
$210,000
Interest Rate
7.05%
Create a Home Valuation Report for This Property
The Home Valuation Report is an in-depth analysis detailing your home's value as well as a comparison with similar homes in the area
Home Values in the Area
Average Home Value in this Area
Purchase History
| Date | Buyer | Sale Price | Title Company |
|---|---|---|---|
| Price Family Trust | -- | None Listed On Document | |
| Price Family Trust | -- | None Listed On Document | |
| Price Ryan | -- | American Title Co | |
| Price Ryan | -- | First American Title Co | |
| Price Ryan | $286,500 | First American Title Ins Co |
Source: Public Records
Mortgage History
| Date | Status | Borrower | Loan Amount |
|---|---|---|---|
| Previous Owner | Price Ryan | $284,900 | |
| Previous Owner | Price Ryan | $210,000 |
Source: Public Records
Tax History Compared to Growth
Tax History
| Year | Tax Paid | Tax Assessment Tax Assessment Total Assessment is a certain percentage of the fair market value that is determined by local assessors to be the total taxable value of land and additions on the property. | Land | Improvement |
|---|---|---|---|---|
| 2025 | $6,317 | $423,089 | $73,854 | $349,235 |
| 2024 | $6,317 | $414,794 | $72,406 | $342,388 |
| 2023 | $6,014 | $406,662 | $70,987 | $335,675 |
| 2022 | $5,909 | $398,690 | $69,596 | $329,094 |
| 2021 | $5,944 | $390,874 | $68,232 | $322,642 |
| 2020 | $5,953 | $386,867 | $67,533 | $319,334 |
| 2019 | $5,847 | $379,282 | $66,209 | $313,073 |
| 2018 | $5,638 | $371,846 | $64,911 | $306,935 |
| 2017 | $5,492 | $364,556 | $63,639 | $300,917 |
| 2016 | $5,466 | $357,409 | $62,392 | $295,017 |
| 2015 | $5,609 | $352,041 | $61,455 | $290,586 |
| 2014 | $5,328 | $345,146 | $60,252 | $284,894 |
Source: Public Records
Map
Nearby Homes
- 4922 Brookdale Dr Unit 128
- 173 Julia Island Cir
- 4916 Brookdale Dr Unit 130
- 4229 Bouquet Way
- 4216 Brookside Dr
- 4923 Gardendell Rd
- 4901 Gardendell Rd
- 4224 Floral Dr
- 3604 Sardinia Island Way
- 4876 Brookdale Dr Unit 161
- 4223 Dardanelles St
- 133 Lily Bay Cir
- 4137 Adriatic Sea Way
- 29 Windcatcher Ct
- 3718 Mirtoon Sea Ave
- 4 Windcatcher Ct
- 53 Goose Haven Ct
- 4348 Natomas Central Dr
- 4111 Windsong St
- 4418 Natomas Central Dr
- 4620 Windsong St
- 4612 Windsong St
- 4638 Windsong St
- 4627 Windsong St
- 4621 Windsong St
- 4633 Windsong St
- 4606 Windsong St
- 4615 Windsong St
- 4925 Brookdale Dr Unit 151
- 4923 Brookdale Dr Unit 150
- 189 Julia Island Cir
- 185 Julia Island Cir
- 4609 Windsong St
- 4641 Windsong St
- 4919 Brookdale Dr Unit 148
- 4198 Hydo Lake Way
- 181 Julia Island Cir
- 4600 Windsong St
- 4917 Brookdale Dr Unit 147
- 4194 Hydo Lake Way