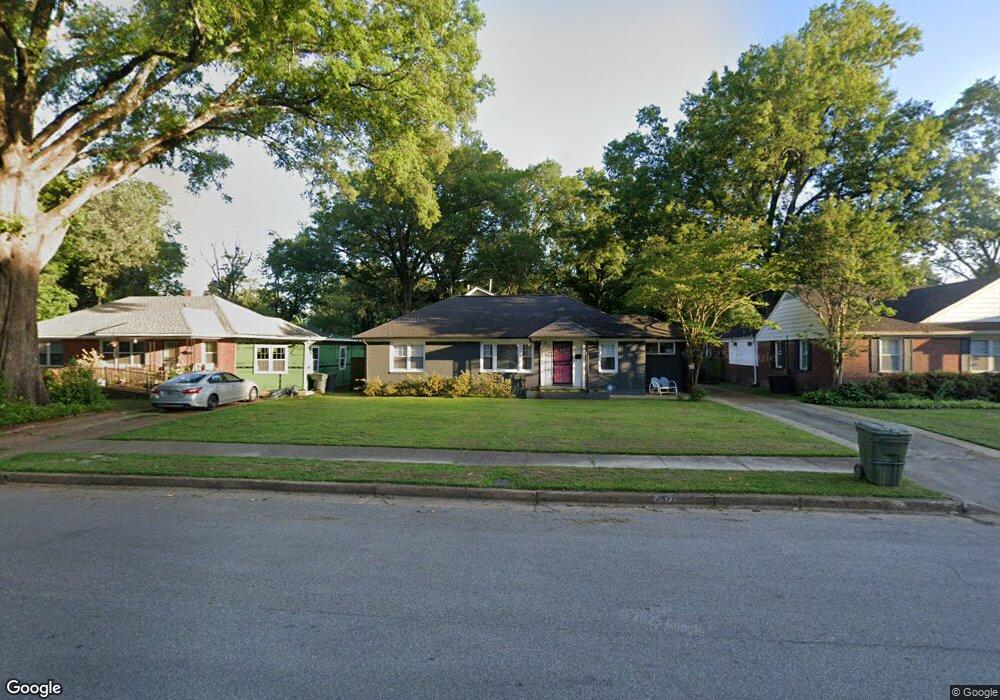
4627 Flamingo Rd Memphis, TN 38117
Colonial Acres NeighborhoodEstimated Value: $213,000 - $275,000
3
Beds
1
Bath
2,377
Sq Ft
$105/Sq Ft
Est. Value
About This Home
This home is located at 4627 Flamingo Rd, Memphis, TN 38117 and is currently estimated at $249,841, approximately $105 per square foot. 4627 Flamingo Rd is a home located in Shelby County with nearby schools including Sherwood Elementary School, Colonial Middle, and Overton High.
Ownership History
Date
Name
Owned For
Owner Type
Purchase Details
Closed on
Jul 12, 2012
Sold by
Pike Arthur L and Pike Constance J
Bought by
Ashe James A and Ashe Holly K
Current Estimated Value
Home Financials for this Owner
Home Financials are based on the most recent Mortgage that was taken out on this home.
Original Mortgage
$57,600
Outstanding Balance
$39,929
Interest Rate
3.76%
Mortgage Type
New Conventional
Estimated Equity
$209,912
Purchase Details
Closed on
Apr 12, 2010
Sold by
Hsbc Bank Usa National Association
Bought by
Pike Arthur L and Pike Constance J
Purchase Details
Closed on
Mar 5, 2010
Sold by
Noe Connie S
Bought by
Hsbc Bank Usa National Association
Purchase Details
Closed on
May 18, 2001
Sold by
Anderson Bennett H and Anderson Bennett J
Bought by
Noe Connie S
Home Financials for this Owner
Home Financials are based on the most recent Mortgage that was taken out on this home.
Original Mortgage
$64,400
Interest Rate
7.11%
Create a Home Valuation Report for This Property
The Home Valuation Report is an in-depth analysis detailing your home's value as well as a comparison with similar homes in the area
Home Values in the Area
Average Home Value in this Area
Purchase History
| Date | Buyer | Sale Price | Title Company |
|---|---|---|---|
| Ashe James A | $72,000 | Fidelity Title & Escrow Inc | |
| Pike Arthur L | $48,700 | None Available | |
| Hsbc Bank Usa National Association | $67,500 | None Available | |
| Noe Connie S | $80,500 | Rudy Title & Escrow Llc |
Source: Public Records
Mortgage History
| Date | Status | Borrower | Loan Amount |
|---|---|---|---|
| Open | Ashe James A | $57,600 | |
| Previous Owner | Noe Connie S | $64,400 |
Source: Public Records
Tax History Compared to Growth
Tax History
| Year | Tax Paid | Tax Assessment Tax Assessment Total Assessment is a certain percentage of the fair market value that is determined by local assessors to be the total taxable value of land and additions on the property. | Land | Improvement |
|---|---|---|---|---|
| 2025 | $2,047 | $69,775 | $9,575 | $60,200 |
| 2024 | $2,047 | $60,375 | $6,650 | $53,725 |
| 2023 | $3,678 | $60,375 | $6,650 | $53,725 |
| 2022 | $2,047 | $60,375 | $6,650 | $53,725 |
| 2021 | $3,721 | $60,375 | $6,650 | $53,725 |
| 2020 | $2,875 | $39,675 | $6,650 | $33,025 |
| 2019 | $2,875 | $39,675 | $6,650 | $33,025 |
| 2018 | $1,804 | $24,900 | $6,650 | $18,250 |
| 2017 | $1,023 | $24,900 | $6,650 | $18,250 |
| 2016 | $1,009 | $23,100 | $0 | $0 |
| 2014 | $1,009 | $23,100 | $0 | $0 |
Source: Public Records
Map
Nearby Homes
- 4576 Amboy Rd
- 1263 S Perkins Rd
- 1258 S Perkins Rd
- 1220 Perkins Terrace
- 1229 S Perkins Rd
- 4506 Verne Rd
- 4545 Verne Rd
- 4491 Fair Meadow Rd
- 4474 Cherrydale Rd
- 1160 W Perkins Rd
- 4502 Quince Rd
- 4468 Cherrydale Rd
- 4493 Quince Rd
- 4491 Garnett Rd
- 4803 Hummingbird Ln
- 4804 Hummingbird Ln
- 1086 Perkins Terrace
- 1305 Cherry Rd
- 4485 Dunn Ave
- 1260 Cherrydale Cove
- 4619 Flamingo Rd
- 4633 Flamingo Rd
- 4613 Flamingo Rd
- 4628 Amboy Rd
- 4643 Flamingo Rd
- 4620 Amboy Rd
- 4634 Amboy Rd
- 4614 Amboy Rd
- 4632 Flamingo Rd
- 4642 Amboy Rd
- 4618 Flamingo Rd
- 4605 Flamingo Rd
- 4651 Flamingo Rd
- 1303 S Perkins Rd
- 4642 Flamingo Rd
- 4608 Amboy Rd
- 4610 Flamingo Rd
- 4599 Flamingo Rd
- 1270 S Perkins Rd
- 1313 S Perkins Rd