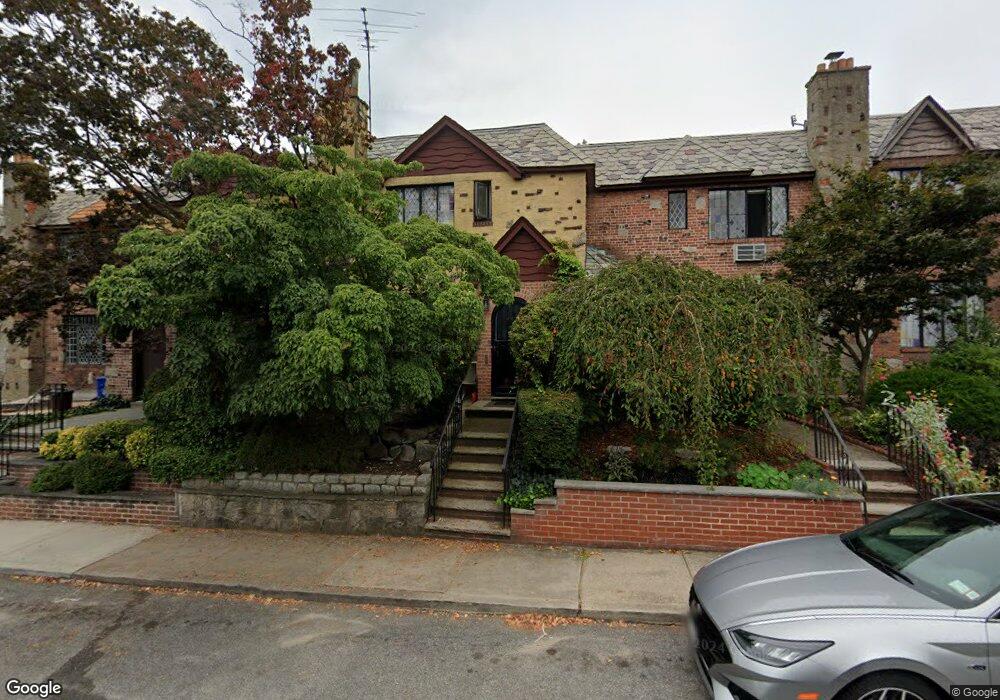
4628 193rd St Flushing, NY 11358
Auburndale NeighborhoodEstimated Value: $911,686 - $1,068,000
Studio
--
Bath
1,600
Sq Ft
$633/Sq Ft
Est. Value
About This Home
This home is located at 4628 193rd St, Flushing, NY 11358 and is currently estimated at $1,012,922, approximately $633 per square foot. 4628 193rd St is a home located in Queens County with nearby schools including P.S. 107 Thomas A Dooley, I.S. 25 Adrien Block, and Francis Lewis High School.
Ownership History
Date
Name
Owned For
Owner Type
Purchase Details
Closed on
Mar 20, 2008
Sold by
Cohen Jon and Weinblatt Ananda D
Bought by
Weinblatt Ananda D
Current Estimated Value
Purchase Details
Closed on
Oct 10, 2000
Sold by
Perez Robert A and Perez Mayra I
Bought by
Weinblatt Ananda D and Cohen Jon
Home Financials for this Owner
Home Financials are based on the most recent Mortgage that was taken out on this home.
Original Mortgage
$252,700
Outstanding Balance
$91,564
Interest Rate
7.83%
Estimated Equity
$921,358
Create a Home Valuation Report for This Property
The Home Valuation Report is an in-depth analysis detailing your home's value as well as a comparison with similar homes in the area
Home Values in the Area
Average Home Value in this Area
Purchase History
| Date | Buyer | Sale Price | Title Company |
|---|---|---|---|
| Weinblatt Ananda D | -- | -- | |
| Weinblatt Ananda D | $337,500 | Fidelity National Title Ins |
Source: Public Records
Mortgage History
| Date | Status | Borrower | Loan Amount |
|---|---|---|---|
| Open | Weinblatt Ananda D | $252,700 | |
| Closed | Weinblatt Ananda D | $34,800 |
Source: Public Records
Tax History
| Year | Tax Paid | Tax Assessment Tax Assessment Total Assessment is a certain percentage of the fair market value that is determined by local assessors to be the total taxable value of land and additions on the property. | Land | Improvement |
|---|---|---|---|---|
| 2025 | $8,936 | $46,241 | $15,137 | $31,104 |
| 2024 | $8,948 | $45,890 | $14,112 | $31,778 |
| 2023 | $8,415 | $43,295 | $12,866 | $30,429 |
| 2022 | $7,867 | $53,580 | $16,440 | $37,140 |
| 2021 | $7,813 | $55,920 | $16,440 | $39,480 |
| 2020 | $7,861 | $53,520 | $16,440 | $37,080 |
| 2019 | $7,707 | $53,820 | $16,440 | $37,380 |
| 2018 | $7,057 | $36,079 | $13,635 | $22,444 |
| 2017 | $6,639 | $34,038 | $14,004 | $20,034 |
| 2016 | $6,110 | $34,038 | $14,004 | $20,034 |
| 2015 | $3,653 | $32,112 | $15,925 | $16,187 |
| 2014 | $3,653 | $31,869 | $16,533 | $15,336 |
Source: Public Records
Map
Nearby Homes
- 4604 195th St
- 45-47 193rd St
- 4539 192nd St
- 4552 196th St
- 45-31 195th St
- 47-55 194th St
- 4719 192nd St
- 47-49 194th St
- 45-66 196th Place
- 47-18 190th St
- 4756 196th St
- 43-44 195th St
- 19005 48th Ave
- 43-28 196th St
- 45-32 Utopia Pkwy
- 196-64 45th Ave
- 4818 190th St
- 199-04 47th Ave
- 47-02 Francis Lewis Blvd
- 171-06 Bagley Ave
Your Personal Tour Guide
Ask me questions while you tour the home.