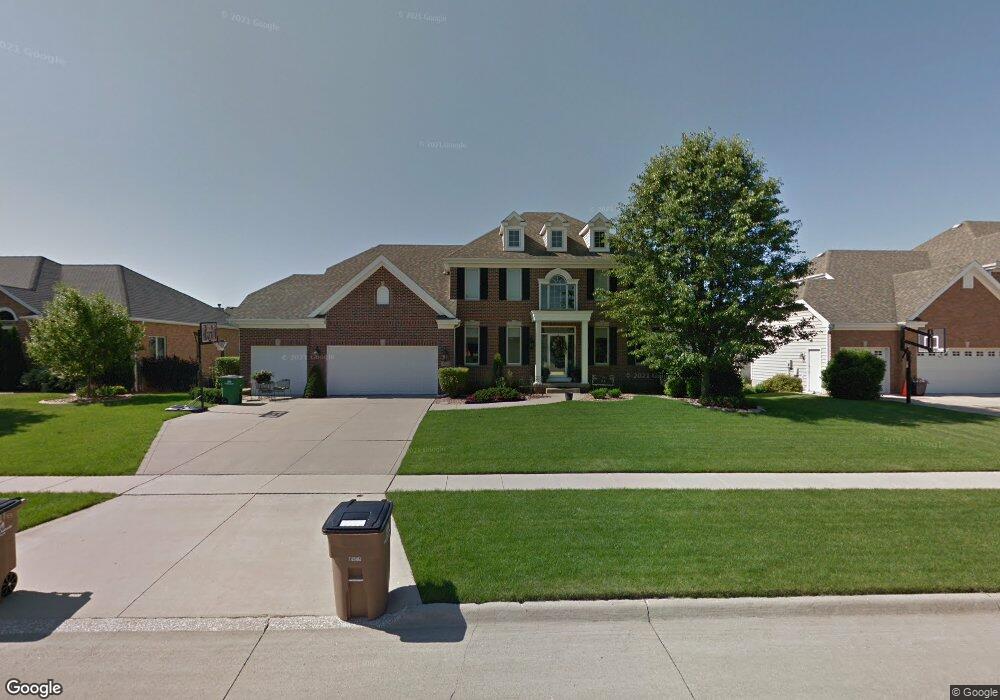
4628 Turnberry Dr West Des Moines, IA 50265
Estimated Value: $642,050 - $716,000
4
Beds
4
Baths
2,997
Sq Ft
$229/Sq Ft
Est. Value
About This Home
This home is located at 4628 Turnberry Dr, West Des Moines, IA 50265 and is currently estimated at $685,513, approximately $228 per square foot. 4628 Turnberry Dr is a home located in Polk County with nearby schools including Jordan Creek Elementary School, Valley Southwoods Freshman High School, and Stilwell Junior High School.
Ownership History
Date
Name
Owned For
Owner Type
Purchase Details
Closed on
Sep 9, 2024
Sold by
Rieser Mark R and Rieser Wendy S
Bought by
Rieser Family Revocable Trust and Rieser
Current Estimated Value
Purchase Details
Closed on
Mar 22, 2002
Sold by
Master Craft Estates Homes Lc
Bought by
Rieser Mark R and Rieser Wendy S
Home Financials for this Owner
Home Financials are based on the most recent Mortgage that was taken out on this home.
Original Mortgage
$300,700
Interest Rate
6.93%
Purchase Details
Closed on
Apr 3, 2001
Sold by
Blumenthal Investment Trusts Lc
Bought by
Regency Land Company Lc
Create a Home Valuation Report for This Property
The Home Valuation Report is an in-depth analysis detailing your home's value as well as a comparison with similar homes in the area
Home Values in the Area
Average Home Value in this Area
Purchase History
| Date | Buyer | Sale Price | Title Company |
|---|---|---|---|
| Rieser Family Revocable Trust | -- | None Listed On Document | |
| Rieser Mark R | $388,500 | -- | |
| Master Craft Estates Homes Lc | -- | -- | |
| Regency Land Company Lc | $60,500 | -- |
Source: Public Records
Mortgage History
| Date | Status | Borrower | Loan Amount |
|---|---|---|---|
| Previous Owner | Rieser Mark R | $300,700 | |
| Closed | Rieser Mark R | $50,000 |
Source: Public Records
Tax History Compared to Growth
Tax History
| Year | Tax Paid | Tax Assessment Tax Assessment Total Assessment is a certain percentage of the fair market value that is determined by local assessors to be the total taxable value of land and additions on the property. | Land | Improvement |
|---|---|---|---|---|
| 2024 | $8,856 | $569,200 | $107,800 | $461,400 |
| 2023 | $8,814 | $569,200 | $107,800 | $461,400 |
| 2022 | $8,708 | $465,300 | $91,300 | $374,000 |
| 2021 | $9,272 | $465,300 | $91,300 | $374,000 |
| 2020 | $9,128 | $470,900 | $91,400 | $379,500 |
| 2019 | $8,762 | $470,900 | $91,400 | $379,500 |
| 2018 | $8,778 | $436,200 | $83,100 | $353,100 |
| 2017 | $8,852 | $436,200 | $83,100 | $353,100 |
| 2016 | $8,656 | $427,300 | $74,300 | $353,000 |
| 2015 | $8,656 | $427,300 | $74,300 | $353,000 |
| 2014 | $8,454 | $412,900 | $70,800 | $342,100 |
Source: Public Records
Map
Nearby Homes
- 4833 Timberline Dr
- 1116 S 50th Place
- 1104 S 51st St
- 4301 Timberwood Dr
- 1145 S 52nd St Unit 1502
- 1117 S 52nd St Unit 1707
- 5060 Baty Ct
- 1602 S 50th Place
- 2536 SE Morningdew Dr
- 1683 S 49th St
- 1625 S 50th Place
- 640 S 50th St Unit 2204
- 1051 Glen Oaks Dr
- 1069 Glen Oaks Dr
- 4425 Mills Civic Pkwy Unit 204
- 4425 Mills Civic Pkwy Unit 1504
- 4425 Mills Civic Pkwy Unit 1304
- 4425 Mills Civic Pkwy Unit 1701
- 1259 Glen Oaks Dr
- 4205 Quail Ct
- 4650 Turnberry Dr
- 4606 Turnberry Dr
- 4631 Timberline Dr
- 4653 Timberline Dr
- 4609 Timberline Dr
- 4714 Turnberry Dr
- 4633 Turnberry Dr
- 4611 Turnberry Dr
- 4655 Turnberry Dr
- 4709 Timberline Dr
- 4744 Turnberry Dr
- 4715 Turnberry Dr
- 1162 S 46th St
- 1174 S 46th St
- 4735 Timberline Dr
- 1150 S 46th St
- 1121 S 46th St
- 1204 S 46th St
- 4634 Timberline Dr
- 4612 Timberline Dr