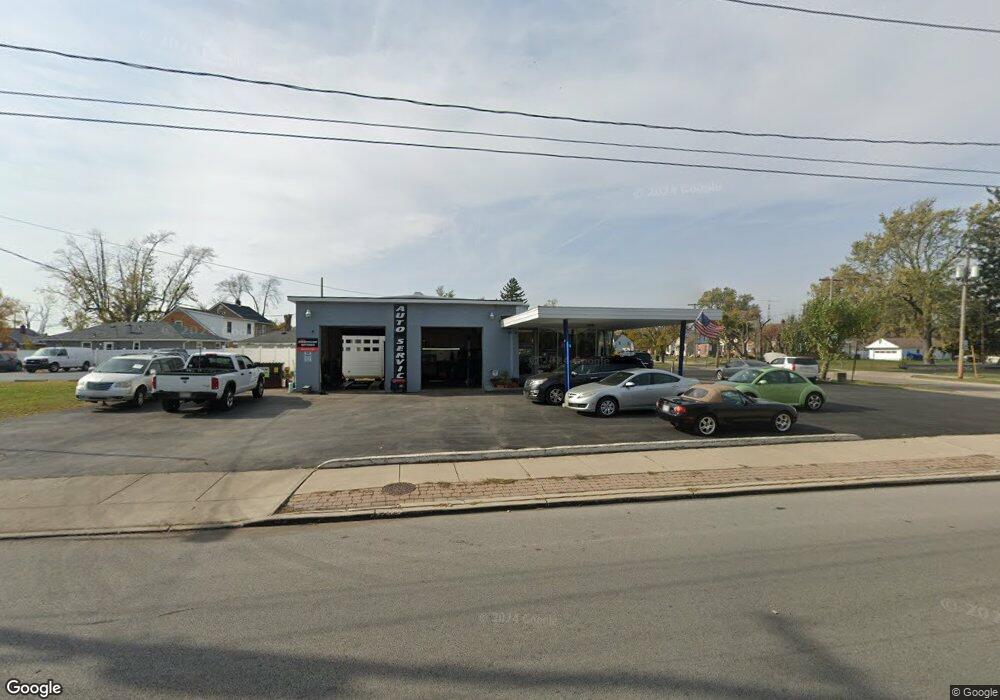
4629 N Summit St Toledo, OH 43611
Point Place NeighborhoodEstimated Value: $370,409
Studio
2
Baths
5,324
Sq Ft
$70/Sq Ft
Est. Value
About This Home
This home is located at 4629 N Summit St, Toledo, OH 43611 and is currently estimated at $370,409, approximately $69 per square foot. 4629 N Summit St is a home located in Lucas County with nearby schools including Ottawa River Elementary School, Woodward High School, and Imagine Environmental Science Academy.
Ownership History
Date
Name
Owned For
Owner Type
Purchase Details
Closed on
Dec 27, 2018
Sold by
Schuster Ronald and Schuster Elizabeth
Bought by
Carrus Inc
Current Estimated Value
Home Financials for this Owner
Home Financials are based on the most recent Mortgage that was taken out on this home.
Original Mortgage
$100,000
Outstanding Balance
$87,583
Interest Rate
4.8%
Mortgage Type
Purchase Money Mortgage
Estimated Equity
$282,826
Purchase Details
Closed on
May 29, 2003
Sold by
Certified Oil Co Northwest
Bought by
Schuster Ronald and Schuster Elizabeth
Home Financials for this Owner
Home Financials are based on the most recent Mortgage that was taken out on this home.
Original Mortgage
$106,250
Interest Rate
5.9%
Mortgage Type
Commercial
Create a Home Valuation Report for This Property
The Home Valuation Report is an in-depth analysis detailing your home's value as well as a comparison with similar homes in the area
Home Values in the Area
Average Home Value in this Area
Purchase History
| Date | Buyer | Sale Price | Title Company |
|---|---|---|---|
| Carrus Inc | $200,000 | None Available | |
| Schuster Ronald | $125,100 | Multiple |
Source: Public Records
Mortgage History
| Date | Status | Borrower | Loan Amount |
|---|---|---|---|
| Open | Carrus Inc | $100,000 | |
| Previous Owner | Schuster Ronald | $106,250 |
Source: Public Records
Tax History
| Year | Tax Paid | Tax Assessment Tax Assessment Total Assessment is a certain percentage of the fair market value that is determined by local assessors to be the total taxable value of land and additions on the property. | Land | Improvement |
|---|---|---|---|---|
| 2025 | -- | $79,170 | $7,945 | $71,225 |
| 2024 | $3,577 | $79,170 | $7,945 | $71,225 |
| 2023 | $7,731 | $79,170 | $7,945 | $71,225 |
| 2022 | $7,695 | $79,170 | $7,945 | $71,225 |
| 2021 | $7,882 | $79,170 | $7,945 | $71,225 |
| 2020 | $6,954 | $65,380 | $26,460 | $38,920 |
| 2019 | $6,803 | $65,380 | $26,460 | $38,920 |
| 2018 | $6,693 | $65,380 | $26,460 | $38,920 |
| 2017 | $6,566 | $62,265 | $24,955 | $37,310 |
| 2016 | $6,603 | $177,900 | $71,300 | $106,600 |
| 2015 | $6,564 | $177,900 | $71,300 | $106,600 |
| 2014 | $5,536 | $62,270 | $24,960 | $37,310 |
| 2013 | $5,536 | $62,270 | $24,960 | $37,310 |
Source: Public Records
Map
Nearby Homes
- 2934 S 109th St
- 2718 Detwiler Dr
- 4532 290th St
- 4539 290th St
- 2426 106th St
- 2831 118th St
- 2750 119th St
- 2352 108th St
- 2835 121st St
- 3056 121st St
- 5202 302nd St
- 5219 302nd St
- 5301 303rd St
- 5338 305th St
- 4745 Ottawa Trail Rd
- 5318 Homeland Dr
- 5159 Grosse Point Pkwy
- 1945 Grimes Golden Dr
- 5433 Brophy Dr
- 4220 Northshire Rd
Your Personal Tour Guide
Ask me questions while you tour the home.