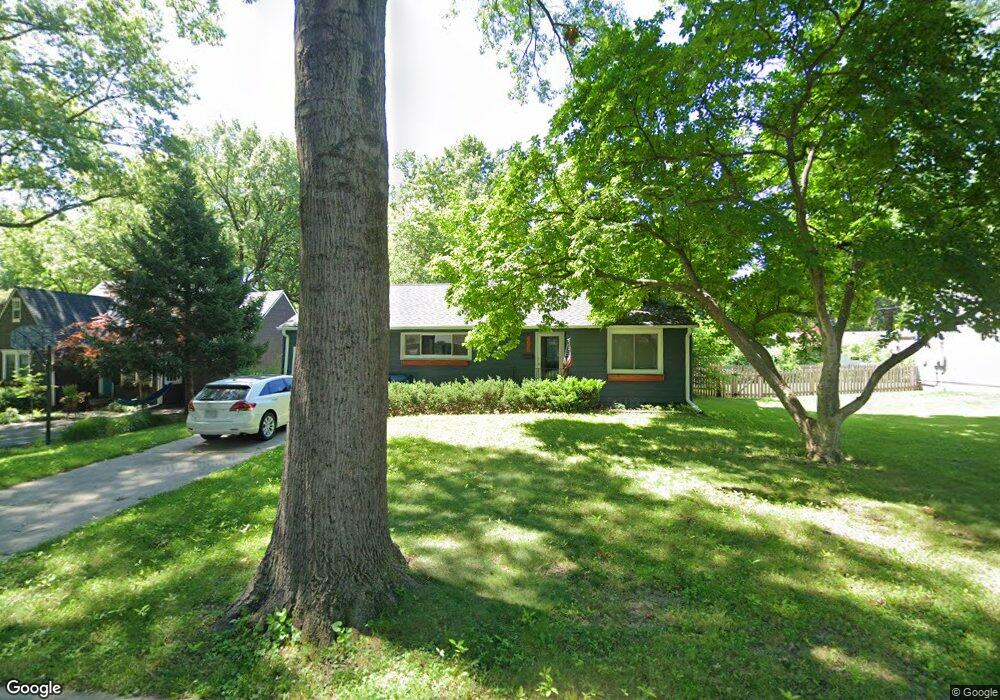
4629 W 72nd St Prairie Village, KS 66208
Estimated Value: $365,000 - $387,000
2
Beds
1
Bath
1,099
Sq Ft
$342/Sq Ft
Est. Value
About This Home
This home is located at 4629 W 72nd St, Prairie Village, KS 66208 and is currently estimated at $375,708, approximately $341 per square foot. 4629 W 72nd St is a home located in Johnson County with nearby schools including Prairie Elementary School, Indian Hills Middle School, and Shawnee Mission East High School.
Ownership History
Date
Name
Owned For
Owner Type
Purchase Details
Closed on
Jul 25, 2011
Sold by
Secretary Of Housing & Urban Development
Bought by
Kalantar Pejmun
Current Estimated Value
Home Financials for this Owner
Home Financials are based on the most recent Mortgage that was taken out on this home.
Original Mortgage
$81,698
Outstanding Balance
$55,511
Interest Rate
4.25%
Mortgage Type
FHA
Estimated Equity
$320,197
Purchase Details
Closed on
Feb 21, 2011
Sold by
Citimortgage Inc
Bought by
Secretary Of Housing & Urban Development
Purchase Details
Closed on
Jan 25, 2011
Sold by
Grauberger Mitchell E
Bought by
Citimortgage Inc
Purchase Details
Closed on
Feb 28, 2002
Sold by
Grauberger Albert E and Grauberger Eve L
Bought by
Grauberger Mitchell E
Home Financials for this Owner
Home Financials are based on the most recent Mortgage that was taken out on this home.
Original Mortgage
$91,350
Interest Rate
6.81%
Mortgage Type
FHA
Create a Home Valuation Report for This Property
The Home Valuation Report is an in-depth analysis detailing your home's value as well as a comparison with similar homes in the area
Home Values in the Area
Average Home Value in this Area
Purchase History
| Date | Buyer | Sale Price | Title Company |
|---|---|---|---|
| Kalantar Pejmun | -- | First American Title | |
| Secretary Of Housing & Urban Development | -- | None Available | |
| Citimortgage Inc | $93,160 | None Available | |
| Grauberger Mitchell E | -- | Columbian National Title Ins |
Source: Public Records
Mortgage History
| Date | Status | Borrower | Loan Amount |
|---|---|---|---|
| Open | Kalantar Pejmun | $81,698 | |
| Previous Owner | Grauberger Mitchell E | $91,350 |
Source: Public Records
Tax History Compared to Growth
Tax History
| Year | Tax Paid | Tax Assessment Tax Assessment Total Assessment is a certain percentage of the fair market value that is determined by local assessors to be the total taxable value of land and additions on the property. | Land | Improvement |
|---|---|---|---|---|
| 2024 | $3,890 | $32,786 | $21,806 | $10,980 |
| 2023 | $3,712 | $30,659 | $20,770 | $9,889 |
| 2022 | $3,525 | $29,014 | $18,057 | $10,957 |
| 2021 | $3,265 | $25,334 | $18,057 | $7,277 |
| 2020 | $2,750 | $20,792 | $16,420 | $4,372 |
| 2019 | $2,582 | $19,228 | $13,682 | $5,546 |
| 2018 | $2,459 | $18,308 | $12,438 | $5,870 |
| 2017 | $1,940 | $13,904 | $9,566 | $4,338 |
| 2016 | $1,492 | $10,097 | $6,829 | $3,268 |
| 2015 | $1,466 | $10,109 | $6,829 | $3,280 |
| 2013 | -- | $9,787 | $5,946 | $3,841 |
Source: Public Records
Map
Nearby Homes
- 4640 W 72nd Terrace
- 4617 W 72nd St
- 7210 Linden St
- 7139 Cedar St
- 7143 Cedar St
- 4705 W 71st Terrace
- 4412 W 72nd St
- 7000 Roe Ave
- 4519 W 70th St
- 5122 W 72nd Terrace
- 5111 W 72nd Terrace
- 7407 Roe Ave
- 4513 W 69th Terrace
- 5202 W 72nd Terrace
- 4306 W 70th St
- 4805 W 69th St
- 7475 Village Dr
- 4918 W 69th Terrace
- 5215 W 71st Terrace
- 5213 W 70th Terrace
- 4623 W 72nd St
- 4635 W 72nd St
- 7211 Roe Ave
- 4636 W 72nd Terrace
- 4648 W 72nd Terrace
- 4632 W 72nd St
- 4611 W 72nd St
- 4624 W 72nd St
- 7115 Roe Ave
- 4620 W 72nd St
- 4632 W 72nd Terrace
- 4601 W 72nd St
- 4616 W 72nd St
- 4612 W 72nd St
- 7105 Roe Ave
- 4529 W 72nd St
- 4641 W 72nd Terrace
- 7120 Roe Ave
- 7210 Roe Ave
- 4637 W 72nd Terrace