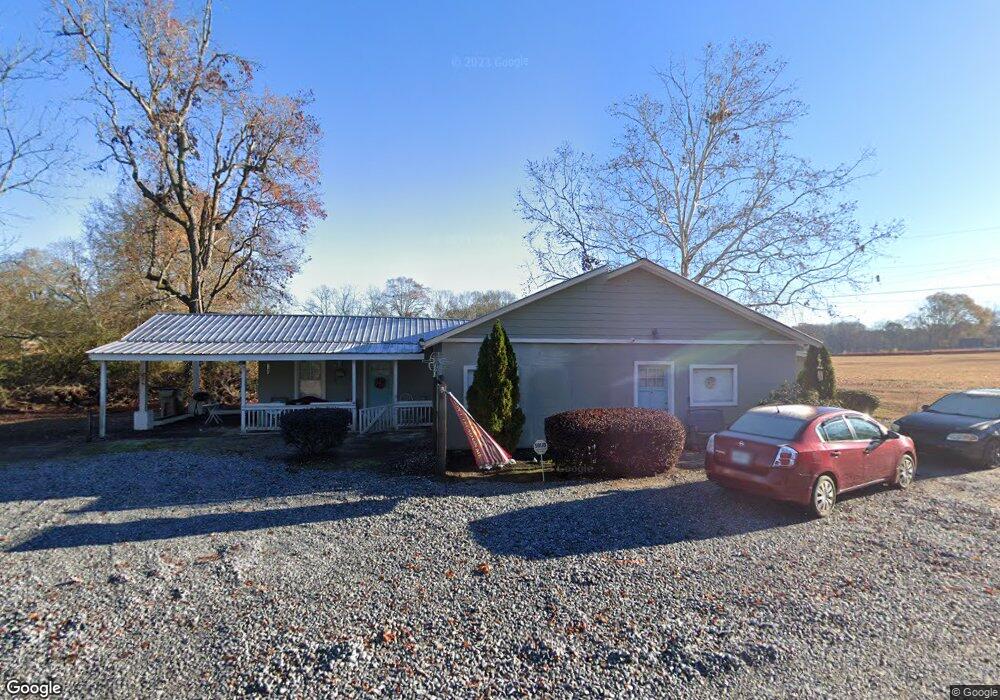
463 Carl Bethlehem Rd SW Unit .34 Bethlehem, GA 30620
Estimated Value: $243,793 - $276,000
2
Beds
1
Bath
1,548
Sq Ft
$170/Sq Ft
Est. Value
About This Home
This home is located at 463 Carl Bethlehem Rd SW Unit .34, Bethlehem, GA 30620 and is currently estimated at $263,198, approximately $170 per square foot. 463 Carl Bethlehem Rd SW Unit .34 is a home located in Barrow County with nearby schools including Bethlehem Elementary School, Haymon-Morris Middle School, and Apalachee High School.
Ownership History
Date
Name
Owned For
Owner Type
Purchase Details
Closed on
May 15, 2018
Sold by
Tnb Llc
Bought by
Tnb 463 Llc
Current Estimated Value
Purchase Details
Closed on
Mar 17, 2017
Sold by
Hensley Troy
Bought by
Tnb Llc
Home Financials for this Owner
Home Financials are based on the most recent Mortgage that was taken out on this home.
Original Mortgage
$65,600
Interest Rate
4.15%
Mortgage Type
Purchase Money Mortgage
Purchase Details
Closed on
Feb 27, 2017
Sold by
Frog Pads Llc
Bought by
Hensley Troy
Home Financials for this Owner
Home Financials are based on the most recent Mortgage that was taken out on this home.
Original Mortgage
$65,600
Interest Rate
4.15%
Mortgage Type
Purchase Money Mortgage
Purchase Details
Closed on
Aug 31, 2005
Sold by
Pad Frog
Bought by
Frog Pad Llc
Purchase Details
Closed on
Mar 10, 2005
Sold by
Thibodeaux David C
Bought by
Pads Frog
Home Financials for this Owner
Home Financials are based on the most recent Mortgage that was taken out on this home.
Original Mortgage
$177,900
Interest Rate
5.54%
Mortgage Type
New Conventional
Purchase Details
Closed on
May 21, 1997
Sold by
Michael Douglas C
Bought by
Christopher Michael
Create a Home Valuation Report for This Property
The Home Valuation Report is an in-depth analysis detailing your home's value as well as a comparison with similar homes in the area
Home Values in the Area
Average Home Value in this Area
Purchase History
| Date | Buyer | Sale Price | Title Company |
|---|---|---|---|
| Tnb 463 Llc | -- | -- | |
| Tnb Llc | -- | -- | |
| Hensley Troy | $82,000 | -- | |
| Frog Pad Llc | -- | -- | |
| Pads Frog | $203,000 | -- | |
| Christopher Michael | -- | -- |
Source: Public Records
Mortgage History
| Date | Status | Borrower | Loan Amount |
|---|---|---|---|
| Previous Owner | Tnb Llc | $65,600 | |
| Previous Owner | Pads Frog | $177,900 |
Source: Public Records
Tax History Compared to Growth
Tax History
| Year | Tax Paid | Tax Assessment Tax Assessment Total Assessment is a certain percentage of the fair market value that is determined by local assessors to be the total taxable value of land and additions on the property. | Land | Improvement |
|---|---|---|---|---|
| 2024 | $1,489 | $59,546 | $16,800 | $42,746 |
| 2023 | $1,266 | $59,546 | $16,800 | $42,746 |
| 2022 | $1,235 | $42,425 | $16,800 | $25,625 |
| 2021 | $1,097 | $35,625 | $10,000 | $25,625 |
| 2020 | $1,100 | $35,625 | $10,000 | $25,625 |
| 2019 | $1,010 | $32,036 | $10,000 | $22,036 |
| 2018 | $993 | $32,036 | $10,000 | $22,036 |
| 2017 | $647 | $22,208 | $10,000 | $12,208 |
| 2016 | $688 | $22,208 | $10,000 | $12,208 |
| 2015 | $691 | $22,208 | $10,000 | $12,208 |
| 2014 | $554 | $17,108 | $4,900 | $12,208 |
| 2013 | -- | $16,497 | $4,900 | $11,597 |
Source: Public Records
Map
Nearby Homes
- 758 Clarence Edwards Rd
- 236 Vision St
- 176 Market St
- 14 Smithwood Dr
- 575 Mackinaw Dr
- 209 Angie Way
- 303 Ron Dr
- 350 Punkin Junction Rd
- 190 Lokeys Ln
- 1111 Otis Dr
- 755 Harry McCarty Rd
- 29 Kielder Dr
- 100 Rivington Dr
- 102 Rivington Dr
- 104 Rivington Dr
- 106 Rivington Dr
- 108 Rivington Dr
- 110 Rivington Dr
- 112 Rivington Dr
- 29 Padley Dr
- 463 Carl Bethlehem Rd SW
- 471 Carl-Bethlehem Rd
- 471 Carl Bethlehem Rd SW
- 0 Carlbethlehem Rd Unit 8792200
- 475 Carl Bethlehem Rd SW
- 709 Clarence Edwards Rd
- 479 Carl Bethlehem Rd SW
- 449 Carl Bethlehem Rd SW
- 449 Carl Bethlehem Rd SW
- 450 Carl Bethlehem Rd SW
- 445 Carl-Bethlehem Rd SW
- 445 Carl Bethlehem Rd SW Unit Rabun
- 445 Carl Bethlehem Rd SW Unit Burton
- 445 Carl Bethlehem Rd SW Unit Rabon
- 445 Carl Bethlehem Rd SW
- 455 Carl Bethlehem Rd SW
- 39 Swansen St
- 719 Clarence Edwards Rd
- 436 Carl Bethlehem Rd SW Unit 1
- 429 Carl Bethlehem Rd SW