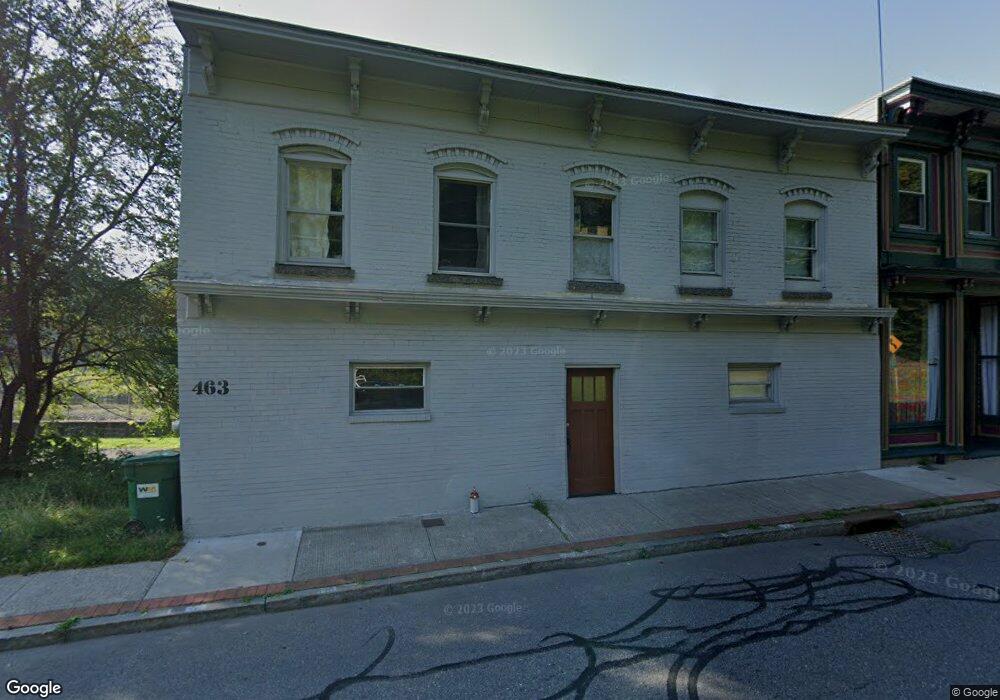
463 Main St Rosendale, NY 12472
Estimated Value: $470,000 - $706,000
4
Beds
2
Baths
2,280
Sq Ft
$245/Sq Ft
Est. Value
About This Home
This home is located at 463 Main St, Rosendale, NY 12472 and is currently estimated at $558,882, approximately $245 per square foot. 463 Main St is a home located in Ulster County with nearby schools including Marbletown Elementary School and Rondout Valley High School.
Ownership History
Date
Name
Owned For
Owner Type
Purchase Details
Closed on
Sep 6, 2006
Sold by
Cafferty Brian P and Posch Leonard J
Bought by
Hollinger Neal A and Hollinger Jane A
Current Estimated Value
Home Financials for this Owner
Home Financials are based on the most recent Mortgage that was taken out on this home.
Original Mortgage
$246,150
Outstanding Balance
$146,611
Interest Rate
6.52%
Mortgage Type
Purchase Money Mortgage
Estimated Equity
$412,271
Create a Home Valuation Report for This Property
The Home Valuation Report is an in-depth analysis detailing your home's value as well as a comparison with similar homes in the area
Home Values in the Area
Average Home Value in this Area
Purchase History
| Date | Buyer | Sale Price | Title Company |
|---|---|---|---|
| Hollinger Neal A | $274,000 | None Available |
Source: Public Records
Mortgage History
| Date | Status | Borrower | Loan Amount |
|---|---|---|---|
| Open | Hollinger Neal A | $246,150 |
Source: Public Records
Tax History Compared to Growth
Tax History
| Year | Tax Paid | Tax Assessment Tax Assessment Total Assessment is a certain percentage of the fair market value that is determined by local assessors to be the total taxable value of land and additions on the property. | Land | Improvement |
|---|---|---|---|---|
| 2024 | $7,626 | $244,100 | $15,000 | $229,100 |
| 2023 | $7,795 | $244,100 | $15,000 | $229,100 |
| 2022 | $7,460 | $244,100 | $15,000 | $229,100 |
| 2021 | $7,460 | $244,100 | $15,000 | $229,100 |
| 2020 | $6,846 | $244,100 | $15,000 | $229,100 |
| 2019 | $6,328 | $226,000 | $15,000 | $211,000 |
| 2018 | $6,182 | $215,000 | $15,000 | $200,000 |
| 2017 | $6,144 | $215,000 | $15,000 | $200,000 |
| 2016 | $6,352 | $215,000 | $15,000 | $200,000 |
| 2015 | -- | $215,000 | $15,000 | $200,000 |
| 2014 | -- | $215,000 | $15,000 | $200,000 |
Source: Public Records
Map
Nearby Homes