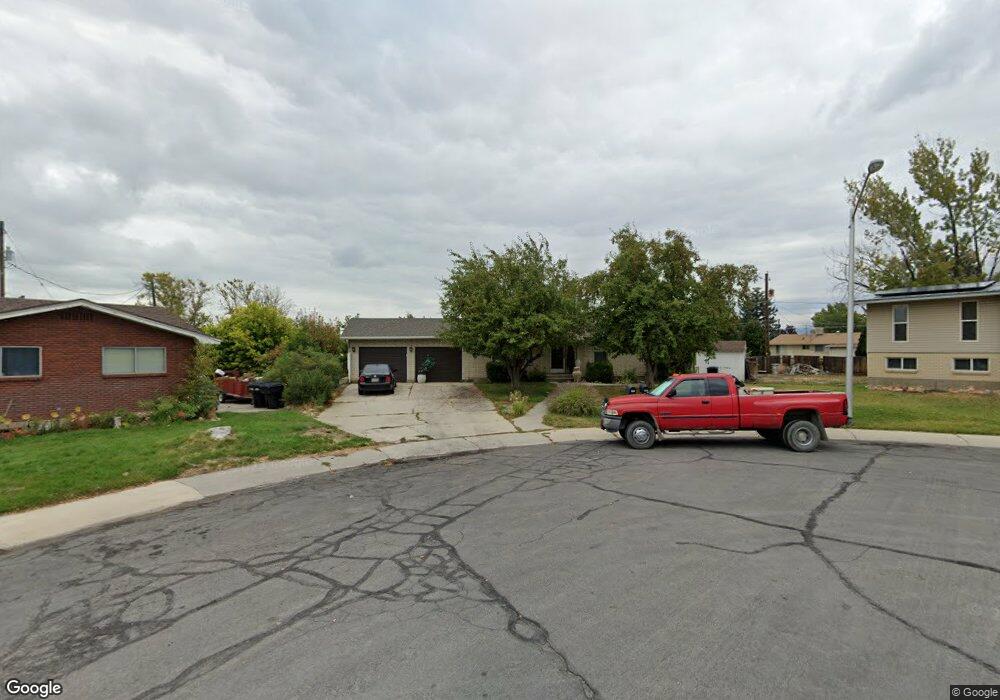
463 N 150 E Orem, UT 84057
Sharon NeighborhoodEstimated Value: $532,000 - $685,000
5
Beds
3
Baths
2,754
Sq Ft
$218/Sq Ft
Est. Value
About This Home
This home is located at 463 N 150 E, Orem, UT 84057 and is currently estimated at $599,164, approximately $217 per square foot. 463 N 150 E is a home located in Utah County with nearby schools including Cascade Elementary School, Canyon View Junior High School, and Orem High School.
Ownership History
Date
Name
Owned For
Owner Type
Purchase Details
Closed on
Dec 21, 2023
Sold by
Budd Michael V and Budd Ana Mercedes
Bought by
Jf Properties Ii Llc
Current Estimated Value
Purchase Details
Closed on
Jan 10, 2016
Sold by
Green Gayla F
Bought by
Budd Michael V and Budd Ana Mercedes
Home Financials for this Owner
Home Financials are based on the most recent Mortgage that was taken out on this home.
Original Mortgage
$169,875
Interest Rate
3.98%
Mortgage Type
New Conventional
Purchase Details
Closed on
Nov 22, 1996
Sold by
Green Gayla F and Vonreece Associates
Bought by
Green Gayla F and Green Marvin R
Home Financials for this Owner
Home Financials are based on the most recent Mortgage that was taken out on this home.
Original Mortgage
$120,000
Interest Rate
7.91%
Create a Home Valuation Report for This Property
The Home Valuation Report is an in-depth analysis detailing your home's value as well as a comparison with similar homes in the area
Home Values in the Area
Average Home Value in this Area
Purchase History
| Date | Buyer | Sale Price | Title Company |
|---|---|---|---|
| Jf Properties Ii Llc | -- | Title One | |
| Budd Michael V | -- | First American | |
| Green Gayla F | -- | -- |
Source: Public Records
Mortgage History
| Date | Status | Borrower | Loan Amount |
|---|---|---|---|
| Previous Owner | Budd Michael V | $169,875 | |
| Previous Owner | Green Gayla F | $120,000 |
Source: Public Records
Tax History
| Year | Tax Paid | Tax Assessment Tax Assessment Total Assessment is a certain percentage of the fair market value that is determined by local assessors to be the total taxable value of land and additions on the property. | Land | Improvement |
|---|---|---|---|---|
| 2025 | $2,189 | $302,995 | -- | -- |
| 2024 | $2,189 | $267,685 | $0 | $0 |
| 2023 | $1,971 | $258,995 | $0 | $0 |
| 2022 | $1,960 | $249,535 | $0 | $0 |
| 2021 | $1,671 | $322,300 | $163,500 | $158,800 |
| 2020 | $1,512 | $286,500 | $130,800 | $155,700 |
| 2019 | $1,300 | $256,200 | $118,200 | $138,000 |
| 2018 | $1,254 | $236,100 | $105,500 | $130,600 |
| 2017 | $1,210 | $122,045 | $0 | $0 |
| 2016 | $1,194 | $111,100 | $0 | $0 |
| 2015 | $1,263 | $111,100 | $0 | $0 |
| 2014 | $1,124 | $98,395 | $0 | $0 |
Source: Public Records
Map
Nearby Homes
Your Personal Tour Guide
Ask me questions while you tour the home.