463 Pearson Cir Newport, NC 28570
Estimated Value: $318,000 - $389,000
3
Beds
1
Bath
822
Sq Ft
$443/Sq Ft
Est. Value
About This Home
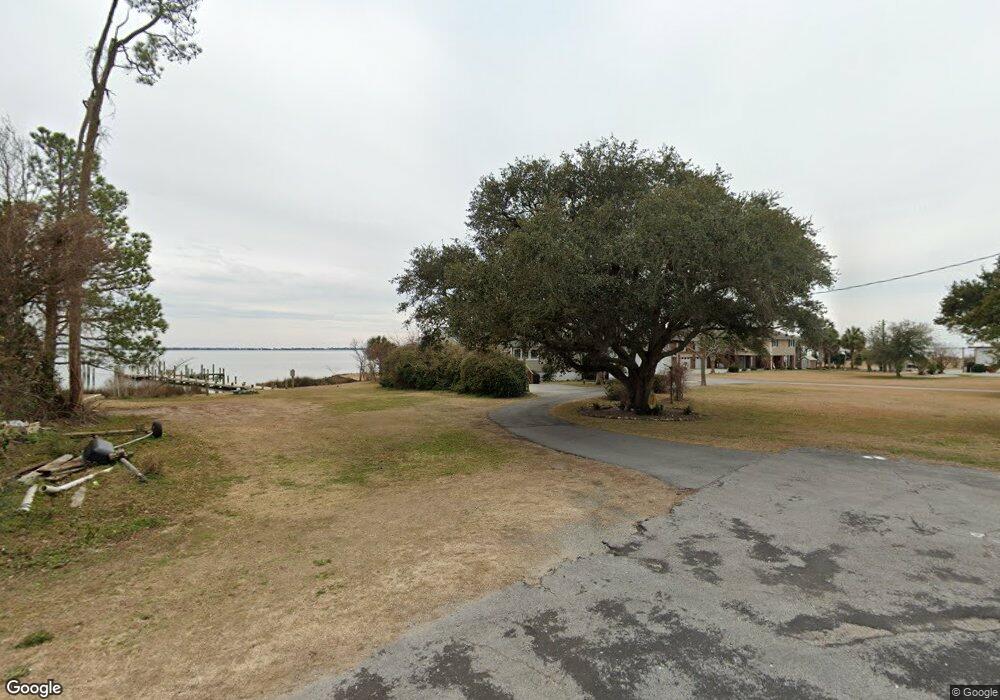
This home is located at 463 Pearson Cir, Newport, NC 28570 and is currently estimated at $364,230, approximately $443 per square foot. 463 Pearson Cir is a home located in Carteret County with nearby schools including Bogue Sound Elementary School, Broad Creek Middle School, and Croatan High School.
Create a Home Valuation Report for This Property
The Home Valuation Report is an in-depth analysis detailing your home's value as well as a comparison with similar homes in the area
Home Values in the Area
Average Home Value in this Area
Tax History Compared to Growth
Tax History
| Year | Tax Paid | Tax Assessment Tax Assessment Total Assessment is a certain percentage of the fair market value that is determined by local assessors to be the total taxable value of land and additions on the property. | Land | Improvement |
|---|---|---|---|---|
| 2025 | $1,647 | $507,998 | $324,425 | $183,573 |
| 2024 | $1,070 | $220,936 | $146,582 | $74,354 |
| 2023 | $1,144 | $220,936 | $146,582 | $74,354 |
| 2022 | $1,122 | $220,936 | $146,582 | $74,354 |
| 2021 | $1,078 | $220,936 | $146,582 | $74,354 |
| 2020 | $1,086 | $220,936 | $146,582 | $74,354 |
| 2019 | $1,061 | $225,938 | $146,582 | $79,356 |
| 2017 | $1,061 | $225,938 | $146,582 | $79,356 |
| 2016 | $1,061 | $225,938 | $146,582 | $79,356 |
| 2015 | $993 | $225,938 | $146,582 | $79,356 |
| 2014 | $1,716 | $426,635 | $345,312 | $81,323 |
Source: Public Records
Map
Nearby Homes
- 444 Pearson Cir
- 128 Creek Bluff Rd
- 600 Pearson Cir
- 264 Pearson Cir
- 124 Creek Bluff Rd
- 114 Creek Bluff Rd
- 107 Creek Bluff Rd
- 204 Junius Dr
- 147 Salty Shores Point
- 112 C St
- 275 Salty Shores Rd
- 109 Pelican Dr
- 108 Henderson Dr
- 111 Key Ln W
- 142 Sunny Point Ln
- 3387 Highway 24
- 680 Broad Creek Loop Rd
- 151 Charles St
- 137 Skipper Ct
- 163 Pine Crest Dr
- 467 Pearson Cir
- 453 Pearson Cir
- 472 Pearson Cir
- 447 Pearson Cir
- 483 Pearson Cir
- 441 Pearson Cir
- 425 Pearson Cir
- 430 Pearson Cir
- 500 Pearson Cir
- 419 Pearson Cir
- 420 Pearson Cir
- 413 Pearson Cir
- 512 Pearson Cir
- 406 & 410 Pearson Cir
- 406 Pearson Cir
- 407 Pearson Cir
- 518 Pearson Cir
- 401 Pearson Cir
- 395 Pearson Cir
- 400 Pearson Cir