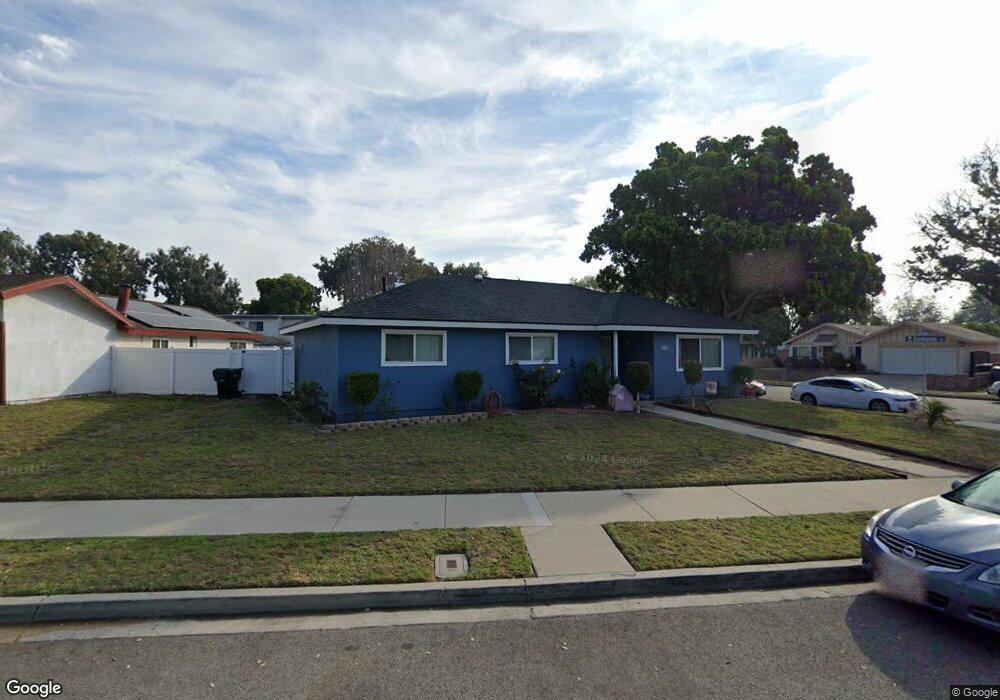
4630 Concord Way Oxnard, CA 93033
Terrace Estates NeighborhoodEstimated Value: $670,137 - $726,000
3
Beds
2
Baths
1,458
Sq Ft
$482/Sq Ft
Est. Value
About This Home
This home is located at 4630 Concord Way, Oxnard, CA 93033 and is currently estimated at $702,034, approximately $481 per square foot. 4630 Concord Way is a home located in Ventura County with nearby schools including Fred L. Williams Elementary School, Channel Islands High School, and St. Anthony's Elementary School.
Ownership History
Date
Name
Owned For
Owner Type
Purchase Details
Closed on
Oct 6, 2009
Sold by
Infante Eric R
Bought by
Gil John J and Gil Renee C
Current Estimated Value
Home Financials for this Owner
Home Financials are based on the most recent Mortgage that was taken out on this home.
Original Mortgage
$270,655
Outstanding Balance
$176,010
Interest Rate
5%
Mortgage Type
FHA
Estimated Equity
$526,024
Purchase Details
Closed on
Nov 15, 2005
Sold by
Laurel Hugo and Laurel Araceli
Bought by
Laurel Luis A and Laurel Isabel
Home Financials for this Owner
Home Financials are based on the most recent Mortgage that was taken out on this home.
Original Mortgage
$115,000
Interest Rate
6.07%
Mortgage Type
Credit Line Revolving
Purchase Details
Closed on
Nov 4, 2005
Sold by
Laurel Luis A and Laurel Isabel
Bought by
Infante Eric R
Home Financials for this Owner
Home Financials are based on the most recent Mortgage that was taken out on this home.
Original Mortgage
$115,000
Interest Rate
6.07%
Mortgage Type
Credit Line Revolving
Purchase Details
Closed on
Jan 4, 2005
Sold by
Laurel Luis A and Laurel Isabel
Bought by
Laurel Luis A and Laurel Isabel
Home Financials for this Owner
Home Financials are based on the most recent Mortgage that was taken out on this home.
Original Mortgage
$340,000
Interest Rate
5.8%
Mortgage Type
New Conventional
Purchase Details
Closed on
Apr 15, 2003
Sold by
Laurel Luis A and Laurel Hugo
Bought by
Laurel Luis A and Laurel Isabell
Home Financials for this Owner
Home Financials are based on the most recent Mortgage that was taken out on this home.
Original Mortgage
$258,825
Interest Rate
5.18%
Mortgage Type
FHA
Purchase Details
Closed on
Mar 16, 2000
Sold by
Jennings Larry D and Jennings Lea D
Bought by
Laurel Luis A and Laurel Hugo
Home Financials for this Owner
Home Financials are based on the most recent Mortgage that was taken out on this home.
Original Mortgage
$190,724
Interest Rate
8.38%
Mortgage Type
FHA
Purchase Details
Closed on
Mar 15, 2000
Sold by
Laurel Araceli
Bought by
Laurel Hugo
Home Financials for this Owner
Home Financials are based on the most recent Mortgage that was taken out on this home.
Original Mortgage
$190,724
Interest Rate
8.38%
Mortgage Type
FHA
Purchase Details
Closed on
Mar 28, 1997
Sold by
Everhart Timothy R and Starkweather Marc B
Bought by
Jennings Larry D and Jennings Lea D
Home Financials for this Owner
Home Financials are based on the most recent Mortgage that was taken out on this home.
Original Mortgage
$133,282
Interest Rate
8.14%
Mortgage Type
FHA
Create a Home Valuation Report for This Property
The Home Valuation Report is an in-depth analysis detailing your home's value as well as a comparison with similar homes in the area
Home Values in the Area
Average Home Value in this Area
Purchase History
| Date | Buyer | Sale Price | Title Company |
|---|---|---|---|
| Gil John J | $280,000 | Chicago Title Company | |
| Laurel Luis A | -- | Fidelity National Title Co | |
| Infante Eric R | $575,000 | Fidelity National Title Co | |
| Laurel Luis A | -- | Alliance Title Company | |
| Laurel Luis A | $86,500 | Lawyers Title Company | |
| Laurel Luis A | $192,000 | Lawyers Title | |
| Laurel Hugo | -- | Lawyers Title | |
| Jennings Larry D | $135,000 | Fidelity National Title |
Source: Public Records
Mortgage History
| Date | Status | Borrower | Loan Amount |
|---|---|---|---|
| Open | Gil John J | $270,655 | |
| Previous Owner | Laurel Luis A | $115,000 | |
| Previous Owner | Infante Eric R | $460,000 | |
| Previous Owner | Laurel Luis A | $340,000 | |
| Previous Owner | Laurel Luis A | $258,825 | |
| Previous Owner | Laurel Luis A | $190,724 | |
| Previous Owner | Jennings Larry D | $133,282 | |
| Closed | Laurel Luis A | $11,520 |
Source: Public Records
Tax History
| Year | Tax Paid | Tax Assessment Tax Assessment Total Assessment is a certain percentage of the fair market value that is determined by local assessors to be the total taxable value of land and additions on the property. | Land | Improvement |
|---|---|---|---|---|
| 2025 | $4,248 | $361,417 | $180,710 | $180,707 |
| 2024 | $4,248 | $354,331 | $177,167 | $177,164 |
| 2023 | $3,998 | $347,384 | $173,693 | $173,691 |
| 2022 | $3,914 | $340,573 | $170,287 | $170,286 |
| 2021 | $3,961 | $333,896 | $166,948 | $166,948 |
| 2020 | $4,033 | $330,474 | $165,237 | $165,237 |
| 2019 | $3,910 | $323,996 | $161,998 | $161,998 |
| 2018 | $3,765 | $317,644 | $158,822 | $158,822 |
| 2017 | $3,642 | $311,416 | $155,708 | $155,708 |
| 2016 | $3,467 | $305,310 | $152,655 | $152,655 |
| 2015 | $3,519 | $300,726 | $150,363 | $150,363 |
| 2014 | $3,471 | $294,836 | $147,418 | $147,418 |
Source: Public Records
Map
Nearby Homes
- 4340 Highland Ave
- 4200 Browning Dr
- 5222 Longfellow Way
- 5117 Jefferson Square
- 860 Morro Way
- 4032 Mockingbird Ln
- 2117 Cardinal Ave Unit 2117h
- 2177 Robin Ave Unit 2177A
- 2178 Thrush Ave Unit J
- 3700 Olds Rd Unit 86
- 1645 Lime Ave Unit 91
- 4160 Petit Dr Unit 39
- 320 Columbia Place Unit 46
- 280 Columbia Place Unit 48
- 1407 Peach Ave Unit 14
- 360 Ibsen Place Unit 129
- 3130 Paula St
- 5225 Columbus Place
- 140 Gaviota Place Unit 157
- 3151 Fournier St
- 4600 Concord Way
- 1610 Berkshire St
- 1600 Berkshire St
- 4631 Concord Way
- 4621 Concord Way
- 4641 Concord Way
- 1540 Berkshire St
- 4530 Concord Way
- 4601 Concord Way
- 1530 Berkshire St
- 4535 Concord Way
- 4520 Concord Way
- 4624 Boston Way
- 4614 Boston Way
- 4700 Boston Way
- 1520 Berkshire St
- 4604 Boston Way
- 4521 Concord Way
- 4710 Boston Way
- 4510 Concord Way
Your Personal Tour Guide
Ask me questions while you tour the home.