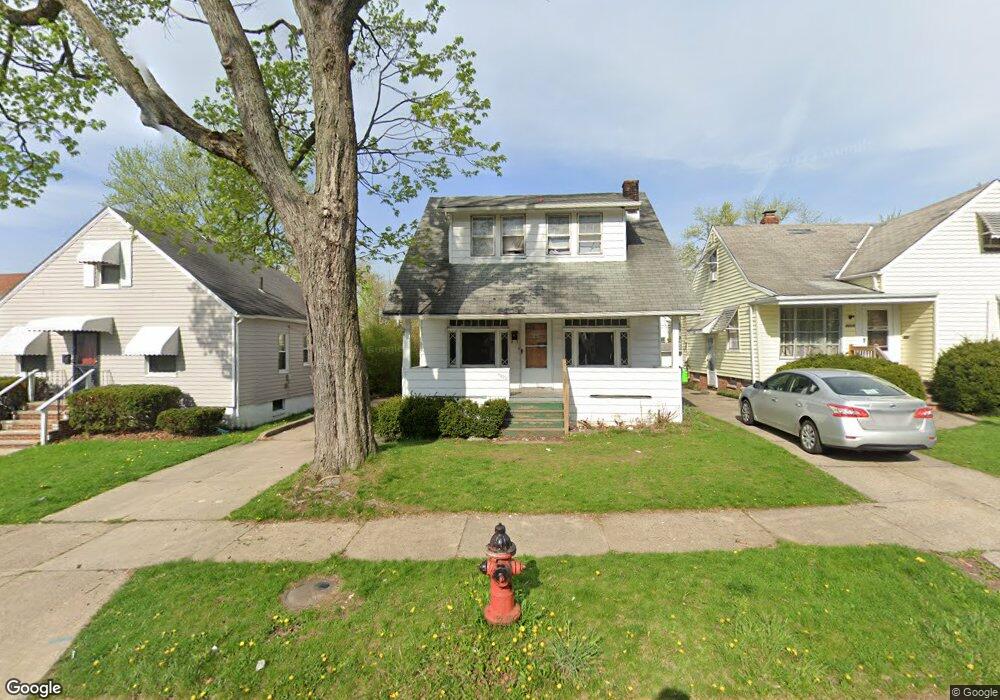
4630 E 86th St Cleveland, OH 44125
Estimated Value: $100,000 - $112,000
3
Beds
2
Baths
1,200
Sq Ft
$89/Sq Ft
Est. Value
About This Home
This home is located at 4630 E 86th St, Cleveland, OH 44125 and is currently estimated at $106,416, approximately $88 per square foot. 4630 E 86th St is a home located in Cuyahoga County with nearby schools including Garfield Heights High School, North Shore High School, and Holy Name Elementary School.
Ownership History
Date
Name
Owned For
Owner Type
Purchase Details
Closed on
Apr 26, 2023
Sold by
Sae Properties Llc
Bought by
Watson Sharod
Current Estimated Value
Home Financials for this Owner
Home Financials are based on the most recent Mortgage that was taken out on this home.
Original Mortgage
$76,000
Outstanding Balance
$73,488
Interest Rate
6.6%
Mortgage Type
New Conventional
Estimated Equity
$32,928
Purchase Details
Closed on
May 5, 2022
Sold by
Dcjc Investments Limited
Bought by
Sae Properties Llc
Purchase Details
Closed on
Sep 6, 2018
Sold by
Langman Laurie and Estate Of Patricia A Marzec
Bought by
Dcjc Investments Limited
Purchase Details
Closed on
Apr 5, 1991
Sold by
Thompson William J
Bought by
Marzec Patricia Ann
Purchase Details
Closed on
Sep 27, 1989
Sold by
Thompson Wm J and Thompson Gertrude G
Bought by
Thompson William J
Purchase Details
Closed on
Jan 1, 1975
Bought by
Thompson Wm J and Thompson Gertrude G
Create a Home Valuation Report for This Property
The Home Valuation Report is an in-depth analysis detailing your home's value as well as a comparison with similar homes in the area
Home Values in the Area
Average Home Value in this Area
Purchase History
| Date | Buyer | Sale Price | Title Company |
|---|---|---|---|
| Watson Sharod | $95,000 | Ohio Real Title | |
| Sae Properties Llc | $75,000 | Leska Abbie B | |
| Dcjc Investments Limited | $35,000 | Cuyahoga Title Services | |
| Marzec Patricia Ann | $44,000 | -- | |
| Thompson William J | -- | -- | |
| Thompson Wm J | -- | -- |
Source: Public Records
Mortgage History
| Date | Status | Borrower | Loan Amount |
|---|---|---|---|
| Open | Watson Sharod | $76,000 |
Source: Public Records
Tax History
| Year | Tax Paid | Tax Assessment Tax Assessment Total Assessment is a certain percentage of the fair market value that is determined by local assessors to be the total taxable value of land and additions on the property. | Land | Improvement |
|---|---|---|---|---|
| 2025 | $3,043 | $33,250 | $7,700 | $25,550 |
| 2024 | $3,524 | $33,250 | $7,700 | $25,550 |
| 2023 | $2,791 | $24,260 | $5,250 | $19,010 |
| 2022 | $2,751 | $24,260 | $5,250 | $19,010 |
| 2021 | $2,834 | $24,260 | $5,250 | $19,010 |
| 2020 | $2,427 | $19,390 | $4,200 | $15,190 |
| 2019 | $2,406 | $55,400 | $12,000 | $43,400 |
| 2018 | $1,304 | $19,390 | $4,200 | $15,190 |
| 2017 | $1,256 | $17,890 | $3,330 | $14,560 |
| 2016 | $1,273 | $17,890 | $3,330 | $14,560 |
| 2015 | $1,610 | $17,890 | $3,330 | $14,560 |
| 2014 | $1,610 | $21,810 | $4,060 | $17,750 |
Source: Public Records
Map
Nearby Homes
- 4658 E 88th St
- 8322 Bancroft Ave
- 4643 E 90th St
- 4690 E 90th St
- 4691 Burleigh Rd
- 8304 Garfield Blvd
- 8220 Garfield Blvd
- 0 Grand Division Ave Unit 5144783
- 4633 Warner Rd
- 4723 E 94th St
- 8910 Jeffries Ave
- 4748 E 94th St
- 8511 Jeffries Ave
- 4494 Turney Rd
- 9435 Dorothy Ave
- 4768 Burleigh Rd
- 4550 Effie Rd
- 9509 Rosewood Ave
- 8303 Connecticut Ave
- 7610 Rosewood Ave
Your Personal Tour Guide
Ask me questions while you tour the home.