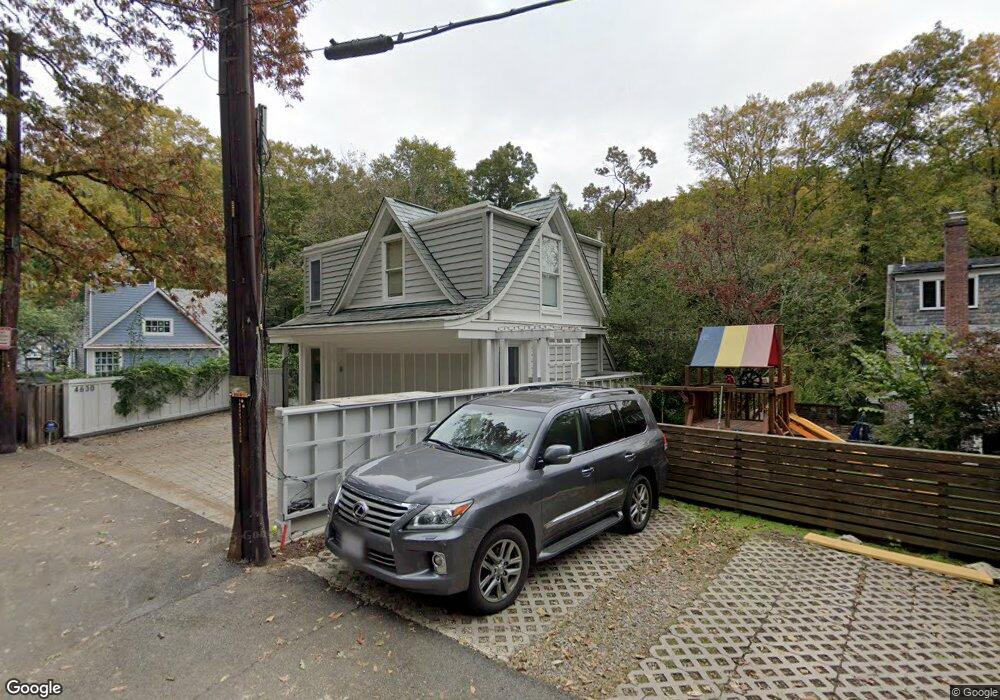
4630 Fieldstone Ln NW Washington, DC 20008
Forest Hills NeighborhoodEstimated Value: $3,003,000 - $3,765,000
5
Beds
7
Baths
4,216
Sq Ft
$797/Sq Ft
Est. Value
About This Home
This home is located at 4630 Fieldstone Ln NW, Washington, DC 20008 and is currently estimated at $3,361,936, approximately $797 per square foot. 4630 Fieldstone Ln NW is a home located in District of Columbia with nearby schools including Ben Murch Elementary School, Sequoia Union Elementary, and Alice Deal Middle School.
Ownership History
Date
Name
Owned For
Owner Type
Purchase Details
Closed on
Dec 3, 2020
Sold by
Mulhall James F and Zuckman Jill B
Bought by
Mulhalla James F and Zuckman Jill B
Current Estimated Value
Purchase Details
Closed on
Jun 26, 2018
Sold by
Rodgers Wescott Holly and Wescott Thomas F
Bought by
Zuckman Jill B and Mulhall James F
Home Financials for this Owner
Home Financials are based on the most recent Mortgage that was taken out on this home.
Original Mortgage
$1,837,500
Outstanding Balance
$1,589,373
Interest Rate
4.6%
Mortgage Type
Adjustable Rate Mortgage/ARM
Estimated Equity
$1,772,563
Purchase Details
Closed on
Aug 28, 2009
Sold by
Du Vivier Anne Keyes and Green Edwin Bernard
Bought by
Wescott Trustee Thomas F and Holly R Wescott 2000 Revoc Tr
Create a Home Valuation Report for This Property
The Home Valuation Report is an in-depth analysis detailing your home's value as well as a comparison with similar homes in the area
Home Values in the Area
Average Home Value in this Area
Purchase History
| Date | Buyer | Sale Price | Title Company |
|---|---|---|---|
| Mulhalla James F | -- | None Available | |
| Zuckman Jill B | $2,450,000 | Paragon Title & Escrow Co | |
| Wescott Trustee Thomas F | $1,850,000 | -- |
Source: Public Records
Mortgage History
| Date | Status | Borrower | Loan Amount |
|---|---|---|---|
| Open | Zuckman Jill B | $1,837,500 |
Source: Public Records
Tax History Compared to Growth
Tax History
| Year | Tax Paid | Tax Assessment Tax Assessment Total Assessment is a certain percentage of the fair market value that is determined by local assessors to be the total taxable value of land and additions on the property. | Land | Improvement |
|---|---|---|---|---|
| 2025 | $20,697 | $2,524,810 | $1,069,400 | $1,455,410 |
| 2024 | $20,174 | $2,460,490 | $1,064,070 | $1,396,420 |
| 2023 | $19,237 | $2,347,120 | $1,027,690 | $1,319,430 |
| 2022 | $19,025 | $2,316,930 | $1,028,100 | $1,288,830 |
| 2021 | $19,000 | $2,311,680 | $1,005,120 | $1,306,560 |
| 2020 | $18,861 | $2,294,590 | $1,012,100 | $1,282,490 |
| 2019 | $18,603 | $2,263,490 | $934,000 | $1,329,490 |
| 2018 | $18,582 | $2,259,490 | $0 | $0 |
| 2017 | $17,665 | $2,150,680 | $0 | $0 |
| 2016 | $17,848 | $2,171,440 | $0 | $0 |
| 2015 | $16,940 | $2,064,380 | $0 | $0 |
| 2014 | $16,497 | $2,010,970 | $0 | $0 |
Source: Public Records
Map
Nearby Homes
- 4656 Broad Branch Rd NW
- 2733 Chesapeake St NW
- 2855 Davenport St NW
- 2916 Chesapeake St NW
- 4838 Broad Branch Rd NW
- 4820 Linnean Ave NW
- 3003 Audubon Terrace NW
- 3031 Gates Rd NW
- 2939 Van Ness St NW Unit 422
- 2939 Van Ness St NW Unit 941
- 2939 Van Ness St NW Unit 640
- 2939 Van Ness St NW Unit 1226
- 2939 Van Ness St NW Unit 731
- 2939 Van Ness St NW Unit 1144
- 2939 Van Ness St NW Unit 706
- 2939 Van Ness St NW Unit 405
- 2939 Van Ness St NW Unit 630
- 2939 Van Ness St NW Unit 421
- 2939 Van Ness St NW Unit 216
- 2939 Van Ness St NW Unit 1031
- 4630 Broad Branch Rd NW
- 4630 Lenore Ln NW
- 4622 Fieldstone Ln NW
- 4622 Broad Branch Rd NW
- 4636 Broad Branch Rd NW
- 4636 Fieldstone Ln NW
- 4630 Fieldstone Ln
- 4600 Fieldstone Ln NW
- 4600 Fieldstone Ln NW
- 4600 Broad Branch Rd NW
- 4650 Broad Branch Rd NW
- 4650 Fieldstone Ln NW
- 2719 Brandywine St NW
- 4652 Broad Branch Rd NW
- 2700 Chesapeake St NW
- 4699 Broad Branch Rd NW
- 4654 Broad Branch Rd NW
- 2720 Brandywine St NW
- 2701 Chesapeake St NW
- 2700 Brandywine St NW