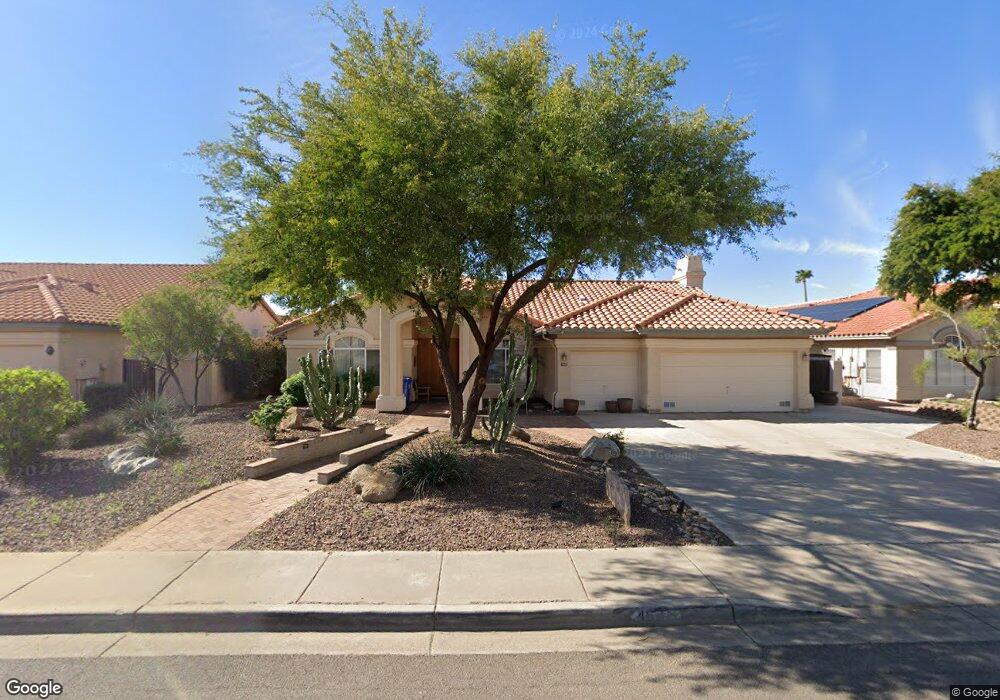
4631 E Acoma Dr Phoenix, AZ 85032
Paradise Valley Village NeighborhoodEstimated Value: $850,061 - $959,000
Studio
3
Baths
2,461
Sq Ft
$365/Sq Ft
Est. Value
About This Home
This home is located at 4631 E Acoma Dr, Phoenix, AZ 85032 and is currently estimated at $897,765, approximately $364 per square foot. 4631 E Acoma Dr is a home located in Maricopa County with nearby schools including Indian Bend Elementary School, Sunrise Middle School, and Paradise Valley High School.
Ownership History
Date
Name
Owned For
Owner Type
Purchase Details
Closed on
Aug 6, 2021
Sold by
Jones Michael T and Jones Christine
Bought by
Jones Christine and Jones Michael T
Current Estimated Value
Purchase Details
Closed on
Apr 25, 2005
Sold by
Farrar H Gordon and Farrar Sue Grandy
Bought by
Jones Michael T and Jones Christine
Home Financials for this Owner
Home Financials are based on the most recent Mortgage that was taken out on this home.
Original Mortgage
$315,000
Outstanding Balance
$155,296
Interest Rate
5%
Mortgage Type
Purchase Money Mortgage
Estimated Equity
$742,469
Purchase Details
Closed on
Sep 20, 2001
Sold by
Johnson Scott Alan and Franklin Evelyn Ruth
Bought by
Farrar H Gordon and Farrar Sue Grandy
Home Financials for this Owner
Home Financials are based on the most recent Mortgage that was taken out on this home.
Original Mortgage
$228,000
Interest Rate
6.84%
Mortgage Type
New Conventional
Purchase Details
Closed on
Mar 9, 2001
Sold by
Johnson Scott and Franklin Evelyn Ruth
Bought by
Johnson Scott Alan and Franklin Evelyn Ruth
Create a Home Valuation Report for This Property
The Home Valuation Report is an in-depth analysis detailing your home's value as well as a comparison with similar homes in the area
Home Values in the Area
Average Home Value in this Area
Purchase History
| Date | Buyer | Sale Price | Title Company |
|---|---|---|---|
| Jones Christine | -- | None Available | |
| Jones Michael T | $514,650 | Security Title Agency Inc | |
| Farrar H Gordon | $285,000 | First American Title | |
| Johnson Scott Alan | -- | -- |
Source: Public Records
Mortgage History
| Date | Status | Borrower | Loan Amount |
|---|---|---|---|
| Open | Jones Michael T | $315,000 | |
| Previous Owner | Farrar H Gordon | $228,000 | |
| Closed | Farrar H Gordon | $27,000 | |
| Closed | Jones Michael T | $40,000 |
Source: Public Records
Tax History
| Year | Tax Paid | Tax Assessment Tax Assessment Total Assessment is a certain percentage of the fair market value that is determined by local assessors to be the total taxable value of land and additions on the property. | Land | Improvement |
|---|---|---|---|---|
| 2025 | $4,264 | $47,599 | -- | -- |
| 2024 | $4,039 | $45,332 | -- | -- |
| 2023 | $4,039 | $66,080 | $13,210 | $52,870 |
| 2022 | $3,992 | $51,250 | $10,250 | $41,000 |
| 2021 | $4,006 | $45,880 | $9,170 | $36,710 |
| 2020 | $3,863 | $43,080 | $8,610 | $34,470 |
| 2019 | $3,869 | $41,520 | $8,300 | $33,220 |
| 2018 | $3,723 | $38,880 | $7,770 | $31,110 |
| 2017 | $3,543 | $37,800 | $7,560 | $30,240 |
| 2016 | $3,474 | $36,580 | $7,310 | $29,270 |
| 2015 | $3,221 | $36,170 | $7,230 | $28,940 |
Source: Public Records
Map
Nearby Homes
- 4617 E Acoma Dr
- 14811 N 44th Place
- 4748 E Redfield Rd
- 4713 E Redfield Rd
- 14830 N 44th Place
- 14243 N 49th St
- 15014 N 48th Place
- 4932 E Evans Dr
- 4350 E Winchcomb Dr
- 4826 E Blanche Dr
- 4364 E Sheena Dr
- 4302 E Acoma Dr
- 13624 N 46th Place
- 4209 E Everett Dr
- 4901 E Ludlow Dr
- 4209 E Acoma Dr
- 5008 E Nisbet Rd
- 4316 E Ludlow Dr
- 13829 N 43rd St
- 5102 E Gelding Dr
- 4625 E Acoma Dr
- 4637 E Acoma Dr
- 4630 E Evans Dr
- 4636 E Evans Dr
- 4624 E Evans Dr
- 4643 E Acoma Dr
- 4618 E Evans Dr
- 4626 E Acoma Dr
- 4642 E Evans Dr
- 4649 E Acoma Dr
- 4618 E Acoma Dr
- 4629 E Evans Dr
- 4623 E Evans Dr
- 4610 E Acoma Dr
- 4635 E Evans Dr
- 14450 N 46th Place
- 14442 N 46th Place
- 4650 E Evans Dr
- 4617 E Evans Dr
- 14434 N 46th Place
Your Personal Tour Guide
Ask me questions while you tour the home.