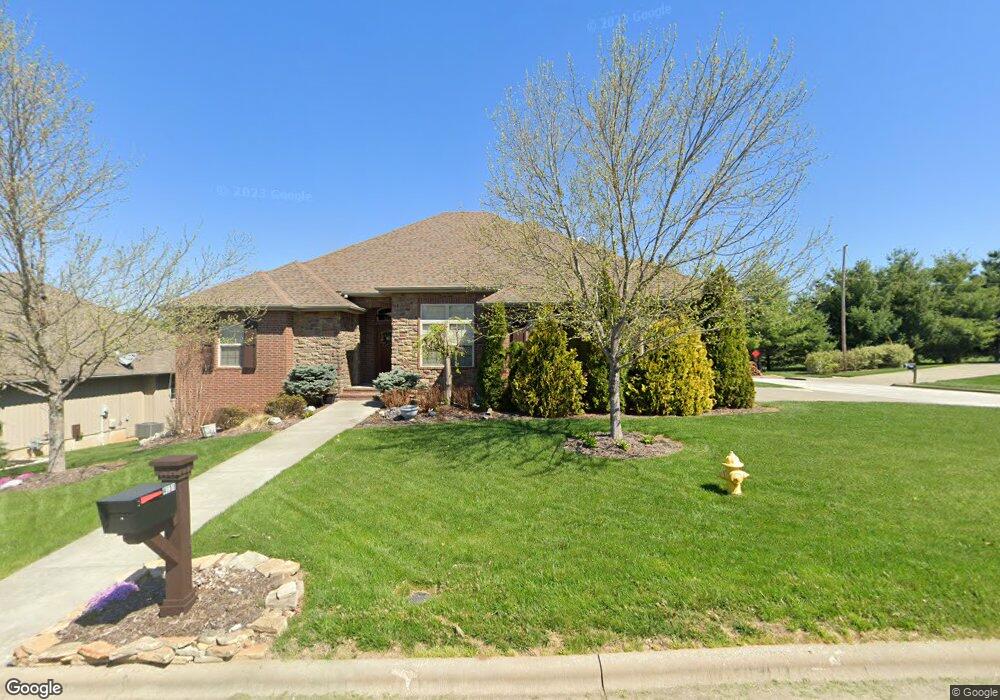
4631 E Viola Vine Dr Springfield, MO 65802
Southeast Springfield NeighborhoodEstimated Value: $407,544 - $508,000
4
Beds
2
Baths
2,156
Sq Ft
$217/Sq Ft
Est. Value
About This Home
This home is located at 4631 E Viola Vine Dr, Springfield, MO 65802 and is currently estimated at $466,886, approximately $216 per square foot. 4631 E Viola Vine Dr is a home with nearby schools including Hickory Hills K-8 School, Glendale High School, and Grace Classical Academy.
Ownership History
Date
Name
Owned For
Owner Type
Purchase Details
Closed on
Feb 27, 2018
Sold by
Marinov Andrew and Marinov Vera
Bought by
Comfort Homes Of Missouri Llc
Current Estimated Value
Purchase Details
Closed on
Feb 28, 2013
Sold by
Sharp Daniel S and Sharp Roxanne M
Bought by
Sharp Daniel Scott and Sahrp Roxanne Marie
Home Financials for this Owner
Home Financials are based on the most recent Mortgage that was taken out on this home.
Original Mortgage
$184,776
Interest Rate
3.12%
Mortgage Type
Adjustable Rate Mortgage/ARM
Purchase Details
Closed on
Feb 27, 2013
Sold by
Martinov Edward and Martinov Alla
Bought by
Sharp Daniel Scott and Sharp Roxanne Marie
Home Financials for this Owner
Home Financials are based on the most recent Mortgage that was taken out on this home.
Original Mortgage
$184,776
Interest Rate
3.12%
Mortgage Type
Adjustable Rate Mortgage/ARM
Purchase Details
Closed on
Oct 2, 2012
Sold by
Martinov Vera
Bought by
Martinov Edward
Purchase Details
Closed on
Oct 1, 2012
Sold by
West Andrey
Bought by
Martinon Edward
Create a Home Valuation Report for This Property
The Home Valuation Report is an in-depth analysis detailing your home's value as well as a comparison with similar homes in the area
Home Values in the Area
Average Home Value in this Area
Purchase History
| Date | Buyer | Sale Price | Title Company |
|---|---|---|---|
| Comfort Homes Of Missouri Llc | -- | None Available | |
| Sharp Daniel Scott | -- | None Available | |
| Sharp Daniel Scott | -- | None Available | |
| Martinov Edward | -- | None Available | |
| Martinon Edward | -- | None Available |
Source: Public Records
Mortgage History
| Date | Status | Borrower | Loan Amount |
|---|---|---|---|
| Previous Owner | Sharp Daniel Scott | $184,776 |
Source: Public Records
Tax History
| Year | Tax Paid | Tax Assessment Tax Assessment Total Assessment is a certain percentage of the fair market value that is determined by local assessors to be the total taxable value of land and additions on the property. | Land | Improvement |
|---|---|---|---|---|
| 2025 | $3,138 | $61,310 | $11,400 | $49,910 |
| 2024 | $3,138 | $55,560 | $8,550 | $47,010 |
| 2023 | $3,153 | $55,560 | $8,550 | $47,010 |
| 2022 | $2,857 | $48,960 | $8,550 | $40,410 |
| 2021 | $2,705 | $48,960 | $8,550 | $40,410 |
| 2020 | $2,626 | $45,240 | $8,550 | $36,690 |
| 2019 | $2,556 | $45,240 | $8,550 | $36,690 |
| 2018 | $2,449 | $43,300 | $7,600 | $35,700 |
| 2017 | $2,426 | $40,380 | $7,600 | $32,780 |
| 2016 | $2,261 | $40,380 | $7,600 | $32,780 |
| 2015 | $2,243 | $40,380 | $7,600 | $32,780 |
| 2014 | $2,199 | $23,450 | $7,600 | $15,850 |
Source: Public Records
Map
Nearby Homes
- 1100 N Farm Road 193
- 4479 E Summerfield Dr
- 700 N Farm Road 193
- 1527 N Edgemont Cir
- 1545 N Oakfair Place
- 4818 E Silverado Rd
- 1581 N Oakfair Place
- 4835 E Silverado Rd
- 4464 E Lancaster Way
- 1653 N Oakfair Place
- 1630 N Waterstone Ave
- 4584 E Hidden Oak St
- 1734 Marlowe Ave
- 4411 E Hidden Oak St
- Lot 50 N Waterstone Ave
- 4156 E Division St
- 4035 E Brookdale Terrace
- Lot 1 Morningwood
- Lot 3 Morningwood
- Lot 4 Wonderview
- 4623 E Viola Vine Dr
- 0 N Elmhurst Rd Unit 11302295
- 0 N Elmhurst Rd
- 1204 N Elmhurst Rd
- 4615 E Viola Vine Dr
- 1204 N Elmhurst
- 1212 N Elmhurst Rd
- 4630 E Viola Vine Dr
- 4622 E Viola Vine Dr
- 4614 E Viola Vine Dr
- 4606 E Viola Vine Dr
- 0 Sunset Ridge Unit 10820180
- 0 Sunset Ridge Unit 10910845
- 0 Sunset Ridge Unit 10910855
- 0 Sunset Ridge Unit 10910853
- 0 Sunset Ridge Unit 10910851
- 0 Sunset Ridge Unit 10910844
- 0 Sunset Ridge Unit 10910850
- 0 Sunset Ridge Unit 10910848
- 0 Sunset Ridge Unit 10910852
Your Personal Tour Guide
Ask me questions while you tour the home.