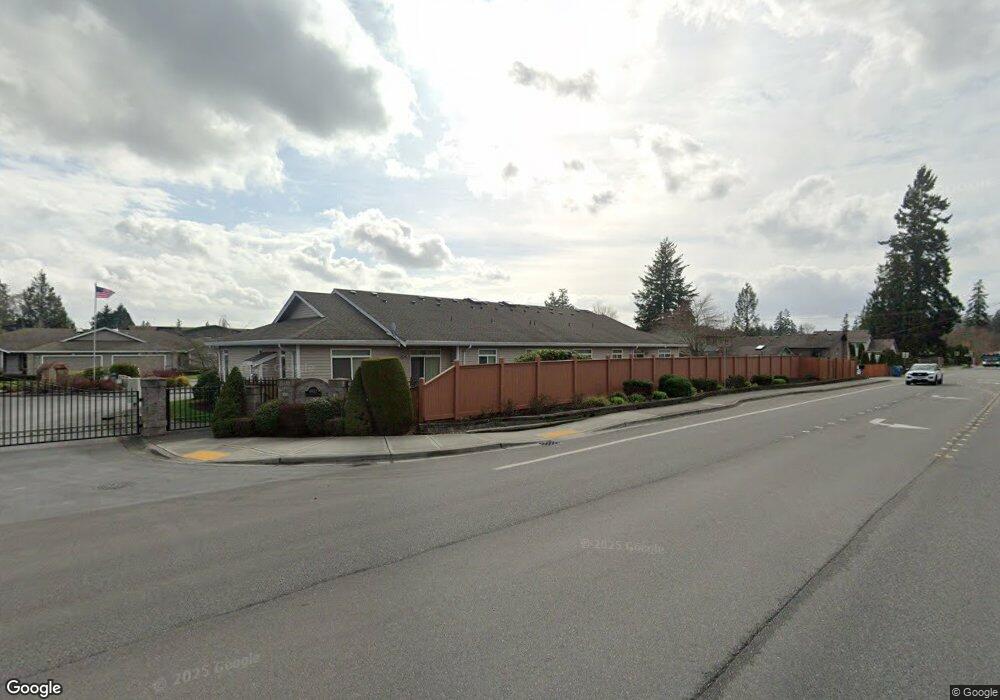
4632 148th St SW Unit 11 Lynnwood, WA 98087
Estimated Value: $641,000 - $852,000
3
Beds
2
Baths
2,066
Sq Ft
$364/Sq Ft
Est. Value
About This Home
This home is located at 4632 148th St SW Unit 11, Lynnwood, WA 98087 and is currently estimated at $751,945, approximately $363 per square foot. 4632 148th St SW Unit 11 is a home located in Snohomish County with nearby schools including Beverly Elementary School, Meadowdale Middle School, and Meadowdale High School.
Ownership History
Date
Name
Owned For
Owner Type
Purchase Details
Closed on
Feb 10, 2022
Sold by
Stevenson George A and Stevenson Frances R
Bought by
Stevenson Family Trust
Current Estimated Value
Purchase Details
Closed on
Jul 14, 2014
Sold by
Simonsen Rick C
Bought by
Stevenson George Allen and Stevenson Frances R
Purchase Details
Closed on
Aug 20, 2013
Sold by
Simonsen Frances M
Bought by
Simonsen Frances M
Purchase Details
Closed on
May 31, 2006
Sold by
Summers Dester W and Summers Jennie A
Bought by
Simonsen Clifford E and Simonsen Frances M
Purchase Details
Closed on
Nov 29, 2005
Sold by
Summers Dester W and Summers Jennie A
Bought by
Summers Dester W and Summers Jennie A
Purchase Details
Closed on
Jan 21, 2004
Sold by
Burtt Julie Ann
Bought by
Summers Dester W and Summers Jennie A
Purchase Details
Closed on
Sep 5, 2003
Sold by
Klammer Barbara L
Bought by
Klammer Barbara L
Create a Home Valuation Report for This Property
The Home Valuation Report is an in-depth analysis detailing your home's value as well as a comparison with similar homes in the area
Home Values in the Area
Average Home Value in this Area
Purchase History
| Date | Buyer | Sale Price | Title Company |
|---|---|---|---|
| Stevenson Family Trust | -- | None Listed On Document | |
| Stevenson George Allen | $415,729 | First American | |
| Simonsen Frances M | -- | None Available | |
| Simonsen Clifford E | $480,000 | Chicago | |
| Summers Dester W | -- | None Available | |
| Summers Dester W | $305,000 | First American | |
| Klammer Barbara L | -- | -- |
Source: Public Records
Tax History Compared to Growth
Tax History
| Year | Tax Paid | Tax Assessment Tax Assessment Total Assessment is a certain percentage of the fair market value that is determined by local assessors to be the total taxable value of land and additions on the property. | Land | Improvement |
|---|---|---|---|---|
| 2025 | $5,560 | $733,600 | $380,000 | $353,600 |
| 2024 | $5,560 | $668,600 | $315,000 | $353,600 |
| 2023 | $5,822 | $732,700 | $325,000 | $407,700 |
| 2022 | $5,605 | $574,800 | $225,000 | $349,800 |
| 2020 | $5,897 | $535,800 | $210,000 | $325,800 |
| 2019 | $5,314 | $480,000 | $160,000 | $320,000 |
| 2018 | $5,343 | $425,400 | $140,000 | $285,400 |
| 2017 | $4,763 | $392,700 | $125,000 | $267,700 |
| 2016 | $4,345 | $359,200 | $102,000 | $257,200 |
| 2015 | $4,305 | $338,200 | $93,000 | $245,200 |
| 2013 | $3,244 | $240,500 | $64,000 | $176,500 |
Source: Public Records
Map
Nearby Homes
- 14913 48th Ave W Unit C-4
- 15109 45th Place W
- 5020 148th St SW Unit E1
- 15217 48th Ave W
- 15304 44th Ave W
- 4630 143rd Place SW
- 5015 144th St SW Unit B1
- 5015 144th St SW Unit A4
- 5015 144th St SW Unit B3
- 5015 144th St SW Unit C1
- 14224 Beverly Park Rd Unit A
- 14714 53rd Ave W Unit 116
- 14714 53rd Ave W Unit 119
- 15026 40th Ave W Unit 8-202
- 15026 40th Ave W Unit 13-302
- 15026 40th Ave W Unit 14-103
- 4032 152nd Place SW
- 4302 155th St SW
- 15302 40th Ave W Unit 2-202
- 4726 Picnic Point Rd
- 4632 148th St SW Unit 12
- 4632 148th St SW Unit 10
- 4632 148th St SW Unit 9
- 4632 148th St SW Unit 8
- 4632 148th St SW Unit 7
- 4632 148th St SW Unit 6
- 4632 148th St SW Unit 5
- 4632 148th St SW Unit 4
- 4632 148th St SW Unit 3
- 4632 148th St SW Unit 2
- 4632 148th St SW Unit 1
- 4718 148th St SW
- 4708 147th Place SW
- 4714 147th Place SW
- 14727 47th Ave W
- 4722 147th Place SW
- 14807 48th Ave W
- 14821 48th Ave W
- 14721 47th Ave W
- 14901 48th Ave W