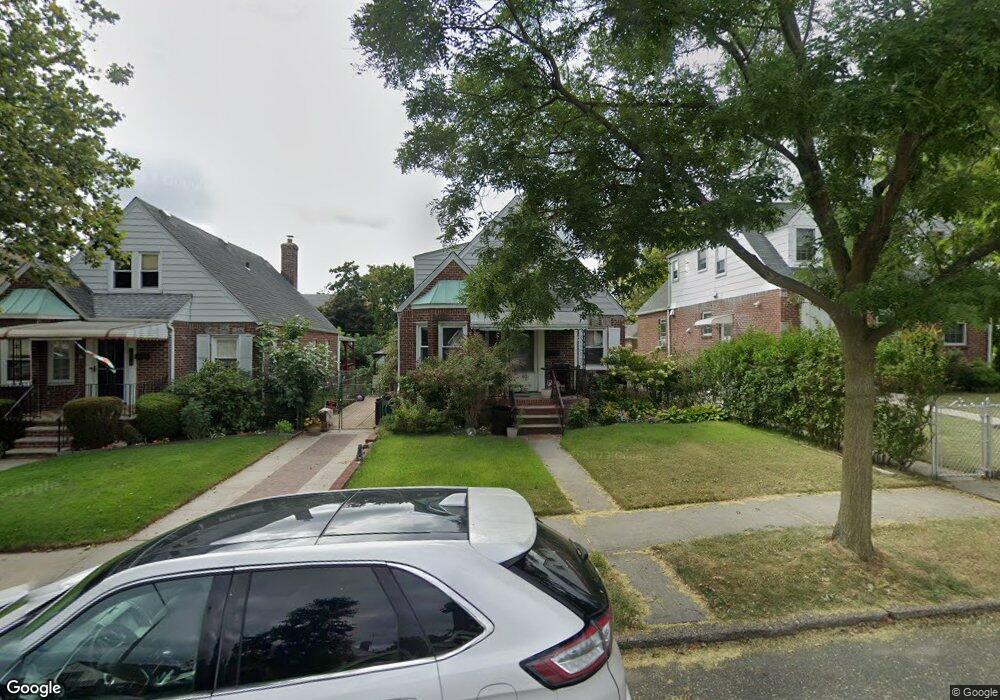
4632 192nd St Flushing, NY 11358
Auburndale NeighborhoodEstimated Value: $1,050,000 - $1,188,000
Studio
--
Bath
1,199
Sq Ft
$933/Sq Ft
Est. Value
About This Home
This home is located at 4632 192nd St, Flushing, NY 11358 and is currently estimated at $1,118,329, approximately $932 per square foot. 4632 192nd St is a home located in Queens County with nearby schools including P.S. 107 Thomas A Dooley, I.S. 25 Adrien Block, and Francis Lewis High School.
Ownership History
Date
Name
Owned For
Owner Type
Purchase Details
Closed on
Nov 19, 2024
Sold by
Dorothea J Monten As Co-Trustee and Dorothea J Monten As Trustee
Bought by
4632 Property Llc
Current Estimated Value
Purchase Details
Closed on
Oct 3, 2017
Sold by
Monten Raymond N
Bought by
Monten As Trustee Dorothea J and Monten As Trustee Raymond N
Purchase Details
Closed on
Jan 13, 2012
Sold by
Ronald Campbell Living Trust Ua Dtd Apri and Ronald Campbell Trustee Or Successors
Bought by
Monten Raymond N
Purchase Details
Closed on
Jan 28, 2008
Sold by
Barbara Ann Campbell Trust and Ronald Campbell Trustee
Bought by
Barbara Ann Campbell Estate and Ronald Campbell Executor
Purchase Details
Closed on
Dec 12, 1995
Sold by
Monten Doris
Bought by
Monten Doris and Monten Raymond N
Purchase Details
Closed on
Jan 18, 1994
Sold by
Monten Doris
Bought by
Monten Doris
Create a Home Valuation Report for This Property
The Home Valuation Report is an in-depth analysis detailing your home's value as well as a comparison with similar homes in the area
Home Values in the Area
Average Home Value in this Area
Purchase History
| Date | Buyer | Sale Price | Title Company |
|---|---|---|---|
| 4632 Property Llc | $1,130,000 | -- | |
| 4632 Property Llc | $1,130,000 | -- | |
| Monten As Trustee Dorothea J | -- | -- | |
| Monten As Trustee Dorothea J | -- | -- | |
| Monten As Trustee Dorothea J | -- | -- | |
| Monten Raymond N | $250,000 | -- | |
| Monten Raymond N | $250,000 | -- | |
| Barbara Ann Campbell Estate | -- | -- | |
| Campbell Ronald | -- | -- | |
| Campbell Ronald | -- | -- | |
| Barbara Ann Campbell Estate | -- | -- | |
| Monten Doris | -- | -- | |
| Monten Doris | -- | -- | |
| Monten Doris | -- | -- | |
| Monten Doris | -- | -- |
Source: Public Records
Tax History
| Year | Tax Paid | Tax Assessment Tax Assessment Total Assessment is a certain percentage of the fair market value that is determined by local assessors to be the total taxable value of land and additions on the property. | Land | Improvement |
|---|---|---|---|---|
| 2025 | $8,732 | $43,474 | $12,966 | $30,508 |
| 2024 | $8,732 | $43,474 | $12,174 | $31,300 |
| 2023 | $8,665 | $43,140 | $13,124 | $30,016 |
| 2022 | $7,710 | $59,880 | $17,340 | $42,540 |
| 2021 | $8,081 | $56,280 | $17,340 | $38,940 |
| 2020 | $7,668 | $48,420 | $17,340 | $31,080 |
| 2019 | $7,579 | $53,340 | $17,340 | $36,000 |
| 2018 | $7,328 | $35,950 | $12,938 | $23,012 |
| 2017 | $6,914 | $33,916 | $13,017 | $20,899 |
| 2016 | $6,397 | $33,916 | $13,017 | $20,899 |
| 2015 | $3,639 | $30,190 | $14,507 | $15,683 |
| 2014 | $3,639 | $30,190 | $15,783 | $14,407 |
Source: Public Records
Map
Nearby Homes
- 4539 192nd St
- 45-47 193rd St
- 4604 195th St
- 4719 192nd St
- 45-31 195th St
- 4552 196th St
- 47-18 190th St
- 47-55 194th St
- 47-49 194th St
- 45-66 196th Place
- 45-32 Utopia Pkwy
- 43-44 195th St
- 19005 48th Ave
- 4756 196th St
- 43-28 196th St
- 4818 190th St
- 171-06 Bagley Ave
- 196-64 45th Ave
- 188-02 Northern Blvd
- 42-25 189th St
- 4632 192nd St Unit 1st Fl
- 4632 192nd St
- 4628 192nd St
- 4628 192nd St Unit 2 Fl
- 4628 192nd St
- 4636 192nd St
- 18950 46th Rd
- 4640 192nd St
- 46-28 192nd St
- 19017 Hollis Court Blvd
- 4620 192nd St
- 46-46 192nd St
- 4646 192nd St
- 18946 46th Rd
- 46-31 192nd St Unit 1
- 4669 Hollis Court Blvd
- 18949 46th Ave
- 46-35 192nd St
- 4616 192nd St
- 4631 192nd St
Your Personal Tour Guide
Ask me questions while you tour the home.