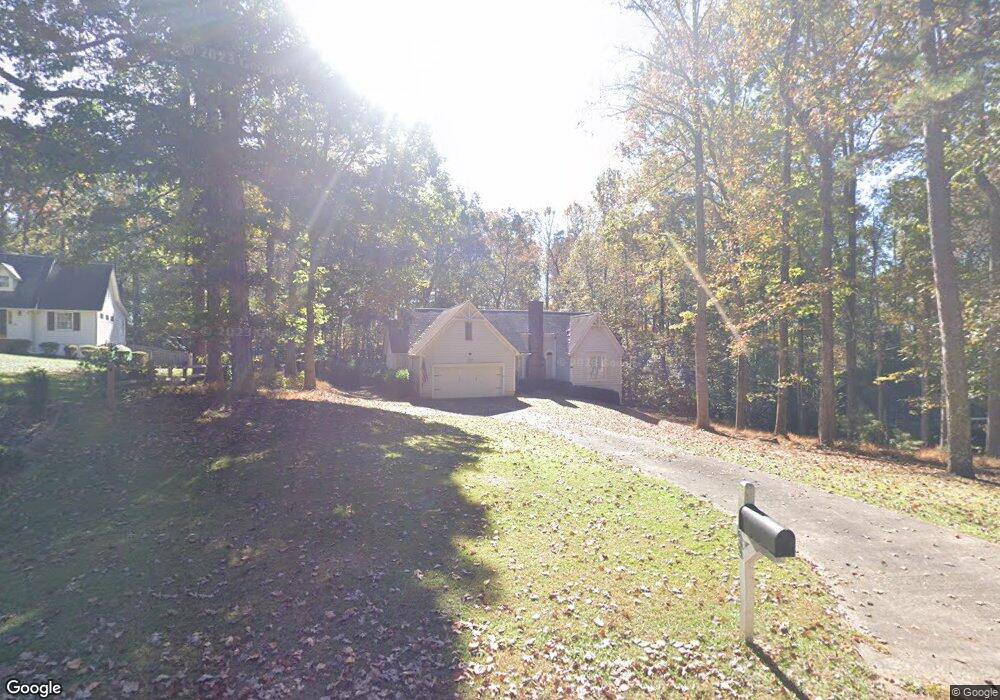
4633 Simpson Downs Gainesville, GA 30507
Southeast Gainesville NeighborhoodEstimated Value: $428,640 - $467,000
3
Beds
2
Baths
1,801
Sq Ft
$249/Sq Ft
Est. Value
About This Home
This home is located at 4633 Simpson Downs, Gainesville, GA 30507 and is currently estimated at $448,410, approximately $248 per square foot. 4633 Simpson Downs is a home located in Hall County with nearby schools including Chestnut Mountain Elementary School, South Hall Middle School, and Johnson High School.
Ownership History
Date
Name
Owned For
Owner Type
Purchase Details
Closed on
Jul 19, 2013
Sold by
Patrick James W
Bought by
Patrick James W
Current Estimated Value
Home Financials for this Owner
Home Financials are based on the most recent Mortgage that was taken out on this home.
Original Mortgage
$153,400
Outstanding Balance
$106,626
Interest Rate
3.06%
Mortgage Type
New Conventional
Estimated Equity
$341,784
Purchase Details
Closed on
Nov 10, 2004
Sold by
Patrick Penelope S
Bought by
Patrick James W
Create a Home Valuation Report for This Property
The Home Valuation Report is an in-depth analysis detailing your home's value as well as a comparison with similar homes in the area
Home Values in the Area
Average Home Value in this Area
Purchase History
| Date | Buyer | Sale Price | Title Company |
|---|---|---|---|
| Patrick James W | -- | -- | |
| Patrick James W | -- | -- |
Source: Public Records
Mortgage History
| Date | Status | Borrower | Loan Amount |
|---|---|---|---|
| Open | Patrick James W | $153,400 |
Source: Public Records
Tax History
| Year | Tax Paid | Tax Assessment Tax Assessment Total Assessment is a certain percentage of the fair market value that is determined by local assessors to be the total taxable value of land and additions on the property. | Land | Improvement |
|---|---|---|---|---|
| 2025 | $1,344 | $187,080 | $33,680 | $153,400 |
| 2024 | $1,421 | $165,520 | $33,360 | $132,160 |
| 2023 | $1,486 | $159,840 | $33,360 | $126,480 |
| 2022 | $1,318 | $140,680 | $34,440 | $106,240 |
| 2021 | $1,186 | $118,960 | $17,720 | $101,240 |
| 2020 | $1,077 | $104,840 | $9,440 | $95,400 |
| 2019 | $1,049 | $99,400 | $9,440 | $89,960 |
| 2018 | $1,001 | $91,640 | $9,440 | $82,200 |
| 2017 | $1,541 | $71,920 | $9,440 | $62,480 |
| 2016 | $1,423 | $69,579 | $8,640 | $60,939 |
| 2015 | $1,426 | $69,579 | $8,640 | $60,939 |
| 2014 | $1,426 | $69,579 | $8,640 | $60,939 |
Source: Public Records
Map
Nearby Homes
- 4745 Shady Lake Cir
- 4609 Hunters Ct
- 4715 Creek Wood Dr
- 5007 Chastain Way
- 5520 Tullis Dr Unit 128A
- 5528 Tullis Dr Unit 130A
- 5528 Tullis Dr
- 5520 Tullis Dr
- Kingston Plan at Ponderosa Farms - Reserve
- Cambridge Plan at Ponderosa Farms - Manor
- 5252 Baymont Dr Unit 30A
- 5259 Baymont Dr Unit 159A
- 5263 Baymont Dr Unit 158A
- Brooke UHP Plan at Ponderosa Farms - Manor
- 5259 Baymont Dr
- 5268 Baymont Dr Unit 34A
- Brookmont Plan at Ponderosa Farms - Reserve
- Wakefield Plan at Ponderosa Farms - Manor
- Rosewood Plan at Ponderosa Farms - Manor
- Canterbury Plan at Ponderosa Farms - Manor
- 4629 Simpson Downs
- 4637 Simpson Downs
- 4641 Simpson Downs
- 4628 Simpson Downs
- 4834 River Bottom Dr
- 4625 Simpson Downs
- 4838 River Bottom Dr
- 4638 Simpson Downs
- 4826 River Bottom Dr
- 4842 River Bottom Dr
- 4621 Simpson Downs
- 4645 Simpson Downs
- 4822 River Bottom Dr
- 4622 Simpson Downs
- 4848 River Bottom Dr
- 4856 River Bottom Dr
- 4706 Oak Glen Ct
- 4705 Oak Glen Ct
- 4864 River Bottom Dr
- 4678 Sherman Allen Rd