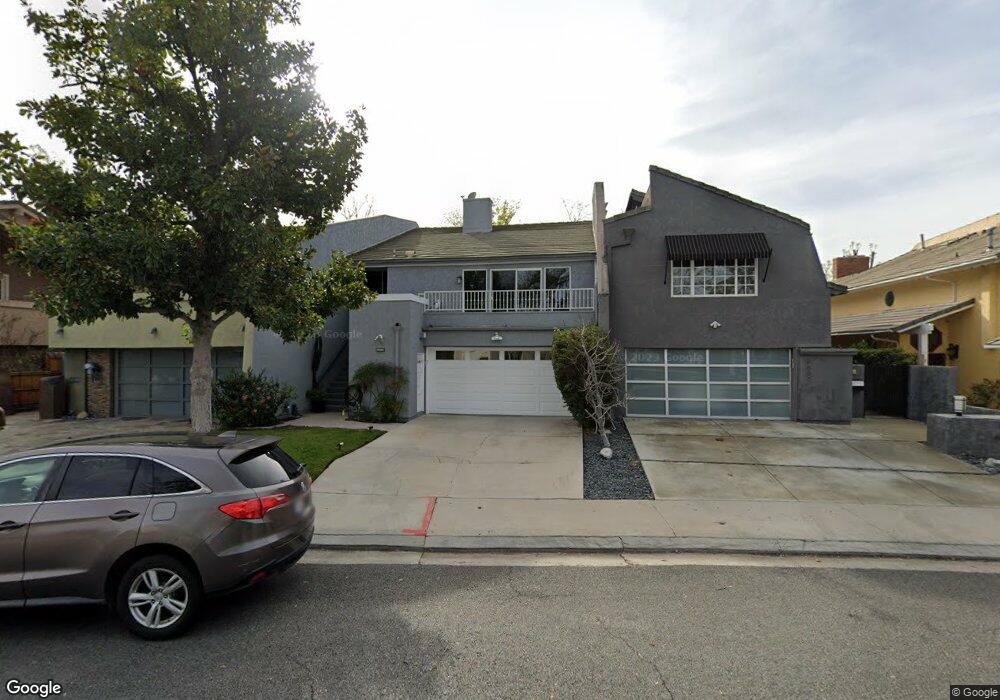
4635 Park Mirasol Calabasas, CA 91302
Estimated Value: $1,603,144 - $2,071,000
3
Beds
4
Baths
2,609
Sq Ft
$714/Sq Ft
Est. Value
About This Home
This home is located at 4635 Park Mirasol, Calabasas, CA 91302 and is currently estimated at $1,862,286, approximately $713 per square foot. 4635 Park Mirasol is a home located in Los Angeles County with nearby schools including Bay Laurel Elementary School, Alice C. Stelle Middle School, and Calabasas High School.
Ownership History
Date
Name
Owned For
Owner Type
Purchase Details
Closed on
Mar 9, 2012
Sold by
Weitzberg Eka Rivka
Bought by
Weitzberg Fred A and 1998 Fred A Weitzberg Trust
Current Estimated Value
Home Financials for this Owner
Home Financials are based on the most recent Mortgage that was taken out on this home.
Original Mortgage
$331,000
Interest Rate
3.83%
Mortgage Type
New Conventional
Purchase Details
Closed on
Jun 8, 2010
Sold by
Weitzberg Fred A and 1998 Fred A Weitzberg Trust
Bought by
Weitzberg Fred A
Purchase Details
Closed on
Jul 27, 1999
Sold by
Weitzberg Fred A
Bought by
Weitzberg Fred A and The 1998 Fred A Weitzberg Trus
Purchase Details
Closed on
May 12, 1999
Sold by
Crawford Everett L and Crawford Delores L
Bought by
Weitzberg Fred A
Home Financials for this Owner
Home Financials are based on the most recent Mortgage that was taken out on this home.
Original Mortgage
$412,000
Interest Rate
6.84%
Create a Home Valuation Report for This Property
The Home Valuation Report is an in-depth analysis detailing your home's value as well as a comparison with similar homes in the area
Home Values in the Area
Average Home Value in this Area
Purchase History
| Date | Buyer | Sale Price | Title Company |
|---|---|---|---|
| Weitzberg Fred A | -- | North American Title | |
| Weitzberg Fred A | -- | Accommodation | |
| Weitzberg Fred A | -- | None Available | |
| Weitzberg Fred A | -- | Equity Title Company | |
| Weitzberg Fred A | $515,000 | Equity Title Company |
Source: Public Records
Mortgage History
| Date | Status | Borrower | Loan Amount |
|---|---|---|---|
| Closed | Weitzberg Fred A | $331,000 | |
| Closed | Weitzberg Fred A | $412,000 |
Source: Public Records
Tax History Compared to Growth
Tax History
| Year | Tax Paid | Tax Assessment Tax Assessment Total Assessment is a certain percentage of the fair market value that is determined by local assessors to be the total taxable value of land and additions on the property. | Land | Improvement |
|---|---|---|---|---|
| 2025 | $10,351 | $807,356 | $492,881 | $314,475 |
| 2024 | $10,351 | $791,526 | $483,217 | $308,309 |
| 2023 | $10,149 | $776,007 | $473,743 | $302,264 |
| 2022 | $9,796 | $760,792 | $464,454 | $296,338 |
| 2021 | $9,734 | $745,876 | $455,348 | $290,528 |
| 2019 | $9,381 | $723,754 | $441,843 | $281,911 |
| 2018 | $9,201 | $709,564 | $433,180 | $276,384 |
| 2016 | $8,721 | $682,012 | $416,360 | $265,652 |
| 2015 | $8,580 | $671,768 | $410,106 | $261,662 |
| 2014 | $8,462 | $658,610 | $402,073 | $256,537 |
Source: Public Records
Map
Nearby Homes
- 4618 Park Mirasol
- 4520 Park Cordero
- 23500 Park Sorrento Unit D21
- 23500 Park Sorrento Unit C34
- 23500 Park Sorrento Unit H32
- 23136 Park Contessa
- 4604 Park Adelfa
- 23391 Park Sorrento Unit 62
- 23635 Park Capri Unit 32
- 23635 Park Capri Unit 30
- 4722 Park Granada Unit 206
- 23675 Park Capri Unit 24
- 4632 Park Granada Unit 93
- 4648 Park Granada Unit 171
- 4716 Park Granada Unit 199
- 4732 Park Granada Unit 224
- 4734 Park Granada Unit 238
- 23677 Park Capri Unit 18
- 23163 Mulholland Dr
- 23169 Mulholland Dr Unit 3
- 4633 Park Mirasol
- 4637 Park Mirasol
- 4631 Park Mirasol
- 4641 Park Mirasol
- 4627 Park Mirasol
- 4643 Park Mirasol
- 4645 Park Mirasol
- 4647 Park Mirasol
- 4625 Park Mirasol
- 4624 Park Mirasol
- 4644 Park Mirasol
- 4623 Park Mirasol
- 4648 Park Mirasol
- 4614 Park Mirasol
- 4617 Park Mirasol
- 4650 Park Mirasol
- 4615 Park Mirasol
- 4610 Park Mirasol
- 4652 Park Mirasol
- 4611 Park Mirasol