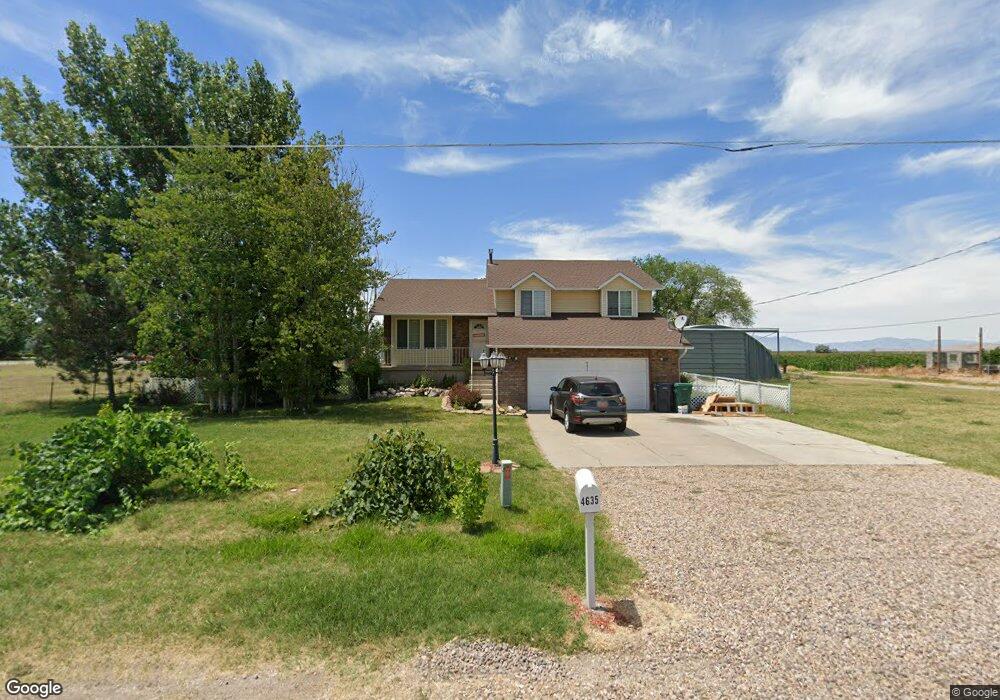
4635 S 6700 W Hooper, UT 84315
Estimated Value: $548,000 - $615,467
4
Beds
2
Baths
2,148
Sq Ft
$271/Sq Ft
Est. Value
About This Home
This home is located at 4635 S 6700 W, Hooper, UT 84315 and is currently estimated at $581,867, approximately $270 per square foot. 4635 S 6700 W is a home located in Weber County with nearby schools including Hooper Elementary School, Rocky Mountain Junior High School, and Fremont High School.
Ownership History
Date
Name
Owned For
Owner Type
Purchase Details
Closed on
Jul 6, 2023
Sold by
Smith Sarah F
Bought by
Stringham Daniel Todd and Stringham Sarah
Current Estimated Value
Home Financials for this Owner
Home Financials are based on the most recent Mortgage that was taken out on this home.
Original Mortgage
$334,900
Outstanding Balance
$326,579
Interest Rate
6.57%
Mortgage Type
New Conventional
Estimated Equity
$255,288
Purchase Details
Closed on
Sep 24, 1997
Sold by
Smith John W and Smith Susan F
Bought by
Smith John W and Smith Susan F
Home Financials for this Owner
Home Financials are based on the most recent Mortgage that was taken out on this home.
Original Mortgage
$124,000
Interest Rate
7.54%
Create a Home Valuation Report for This Property
The Home Valuation Report is an in-depth analysis detailing your home's value as well as a comparison with similar homes in the area
Home Values in the Area
Average Home Value in this Area
Purchase History
| Date | Buyer | Sale Price | Title Company |
|---|---|---|---|
| Stringham Daniel Todd | -- | Stewart Title | |
| Smith John W | -- | Old Republic Title |
Source: Public Records
Mortgage History
| Date | Status | Borrower | Loan Amount |
|---|---|---|---|
| Open | Stringham Daniel Todd | $334,900 | |
| Previous Owner | Smith John W | $124,000 |
Source: Public Records
Tax History Compared to Growth
Tax History
| Year | Tax Paid | Tax Assessment Tax Assessment Total Assessment is a certain percentage of the fair market value that is determined by local assessors to be the total taxable value of land and additions on the property. | Land | Improvement |
|---|---|---|---|---|
| 2025 | $3,266 | $551,721 | $183,565 | $368,156 |
| 2024 | $3,194 | $311,929 | $102,580 | $209,349 |
| 2023 | $3,100 | $300,070 | $101,252 | $198,818 |
| 2022 | $3,513 | $331,650 | $78,236 | $253,414 |
| 2021 | $2,989 | $471,000 | $101,800 | $369,200 |
| 2020 | $2,779 | $396,000 | $91,808 | $304,192 |
| 2019 | $2,638 | $356,998 | $71,800 | $285,198 |
| 2018 | $2,376 | $309,000 | $71,800 | $237,200 |
| 2017 | $1,987 | $247,000 | $54,350 | $192,650 |
| 2016 | $1,836 | $132,675 | $28,857 | $103,818 |
| 2015 | $1,832 | $130,474 | $31,600 | $98,874 |
| 2014 | $1,708 | $118,331 | $31,600 | $86,731 |
Source: Public Records
Map
Nearby Homes
- 6036 W 4700 S
- 4100 S 5900 W
- 5319 S 7100 W
- 5947 W 4600 S
- 6014 W 5300 S
- 4146 S 5800 W Unit 5
- 4163 S 5800 W Unit 2
- 3729 S 5600 W Unit 6
- 3720 S 5600 W Unit 2
- 3719 S 5600 W Unit 7
- 0 W 5500 S
- 5801 S 7100 W
- 3706 S 5650 W Unit 9
- 3691 S 5600 W Unit 20
- 4111 S 5350 W
- 5478 W 3750 S
- 5752 W 2425 N
- 5389 W 3850 S Unit 22
- 5417 W 3850 S
- 5335 W 5500 S