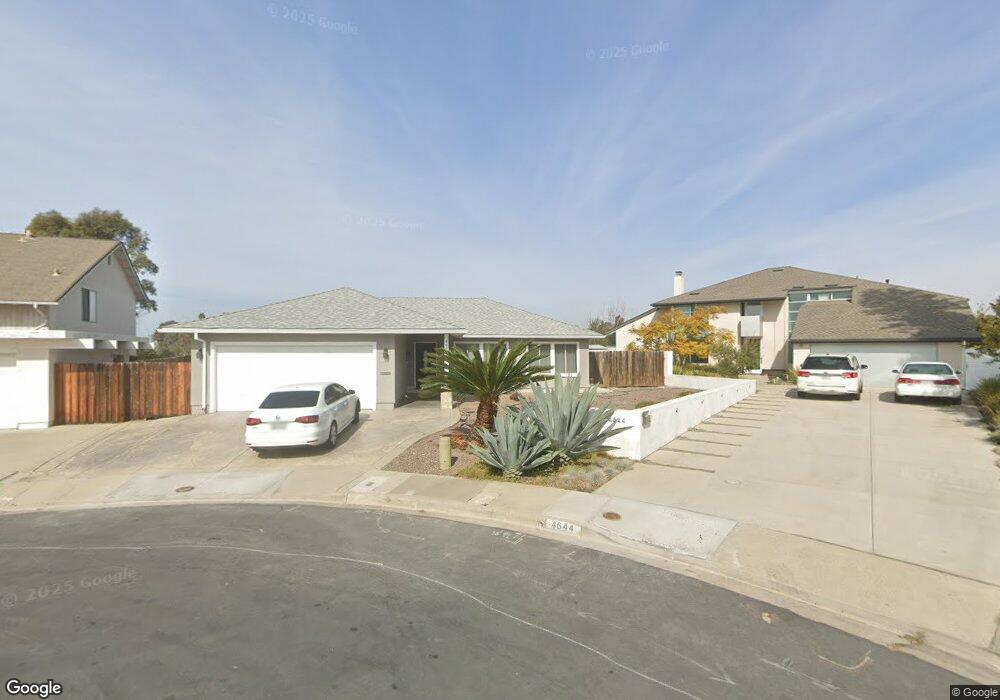
4636 Benhurst Ave San Diego, CA 92122
University City NeighborhoodEstimated Value: $1,406,683 - $1,621,000
4
Beds
2
Baths
1,531
Sq Ft
$986/Sq Ft
Est. Value
About This Home
This home is located at 4636 Benhurst Ave, San Diego, CA 92122 and is currently estimated at $1,508,921, approximately $985 per square foot. 4636 Benhurst Ave is a home located in San Diego County with nearby schools including Marie Curie Elementary School, Standley Middle School, and University City High School.
Ownership History
Date
Name
Owned For
Owner Type
Purchase Details
Closed on
Sep 6, 2018
Sold by
Schultz Henriette Akra
Bought by
Schultz Henriette A and Henriette A Schultz 2018 Trust
Current Estimated Value
Purchase Details
Closed on
Jun 14, 2011
Sold by
Terry Lee C and Terry Beverly F
Bought by
Akra Schultz Henriette
Purchase Details
Closed on
Nov 2, 2004
Sold by
Terry Lee C and Terry Beverly F
Bought by
Terry Lee C and Terry Beverly F
Purchase Details
Closed on
Mar 25, 1996
Sold by
Terry Lee Charles
Bought by
Terry Beverly Faye
Purchase Details
Closed on
Apr 3, 1995
Sold by
Mcevoy Alice B and Fontenot Mark
Bought by
Terry Lee C and Terry Beverly F
Home Financials for this Owner
Home Financials are based on the most recent Mortgage that was taken out on this home.
Original Mortgage
$210,900
Interest Rate
6.2%
Purchase Details
Closed on
Feb 17, 1994
Sold by
Mcevoy Sally R
Bought by
Mcevoy Sally R and Mcevoy Alice B
Create a Home Valuation Report for This Property
The Home Valuation Report is an in-depth analysis detailing your home's value as well as a comparison with similar homes in the area
Home Values in the Area
Average Home Value in this Area
Purchase History
| Date | Buyer | Sale Price | Title Company |
|---|---|---|---|
| Schultz Henriette A | -- | None Available | |
| Akra Schultz Henriette | $530,000 | Fidelity National Title Co | |
| Terry Lee C | -- | -- | |
| Terry Beverly Faye | -- | Fidelity National Title Co | |
| Terry Lee C | $222,000 | Commonwealth Land Title Co | |
| Mcevoy Sally R | -- | -- |
Source: Public Records
Mortgage History
| Date | Status | Borrower | Loan Amount |
|---|---|---|---|
| Previous Owner | Terry Lee C | $210,900 |
Source: Public Records
Tax History Compared to Growth
Tax History
| Year | Tax Paid | Tax Assessment Tax Assessment Total Assessment is a certain percentage of the fair market value that is determined by local assessors to be the total taxable value of land and additions on the property. | Land | Improvement |
|---|---|---|---|---|
| 2025 | $8,210 | $679,010 | $367,037 | $311,973 |
| 2024 | $8,210 | $665,697 | $359,841 | $305,856 |
| 2023 | $8,029 | $652,645 | $352,786 | $299,859 |
| 2022 | $7,816 | $639,849 | $345,869 | $293,980 |
| 2021 | $7,762 | $627,304 | $339,088 | $288,216 |
| 2020 | $7,668 | $620,873 | $335,612 | $285,261 |
| 2019 | $7,532 | $608,700 | $329,032 | $279,668 |
| 2018 | $7,042 | $596,766 | $322,581 | $274,185 |
| 2017 | $6,875 | $585,065 | $316,256 | $268,809 |
| 2016 | $6,765 | $573,594 | $310,055 | $263,539 |
| 2015 | $6,666 | $564,979 | $305,398 | $259,581 |
| 2014 | $6,561 | $553,913 | $299,416 | $254,497 |
Source: Public Records
Map
Nearby Homes
- 4612 Benhurst Ave
- 7056 Haworth St
- 4224 Governor Dr
- 4635 Pauling Ave
- 7212 Florey St
- 4138 Combe Way
- 4627 Huggins St
- 6214 Agee St Unit 34
- 4282 Robbins St
- 6180 Agee St Unit 159
- 5889 Cozzens St
- 6188 Agee St Unit 230
- 6190 Agee St Unit 260
- 6330 Genesee Ave Unit 319
- 6330 Genesee Ave Unit 220
- 6330 Genesee Ave Unit 119
- 6330 Genesee Ave Unit 112
- 6330 Genesee Ave Unit 213
- 6350 Genesee Ave Unit 107
- 6330 Genesee Ave Unit 103
- 4628 Benhurst Ave
- 4644 Benhurst Ave
- 4620 Benhurst Ave
- 4645 Benhurst Ave
- 4697 Robbins St
- 4707 Robbins St
- 4719 Robbins St
- 4637 Benhurst Ave
- 4629 Benhurst Ave
- 4621 Benhurst Ave
- 4729 Robbins St
- 4687 Robbins St
- 4604 Benhurst Ave
- 4613 Benhurst Ave
- 4741 Robbins St
- 4679 Robbins St
- 6470 Panel Ct
- 4605 Benhurst Ave
- 6462 Panel Ct
- 4592 Benhurst Ave