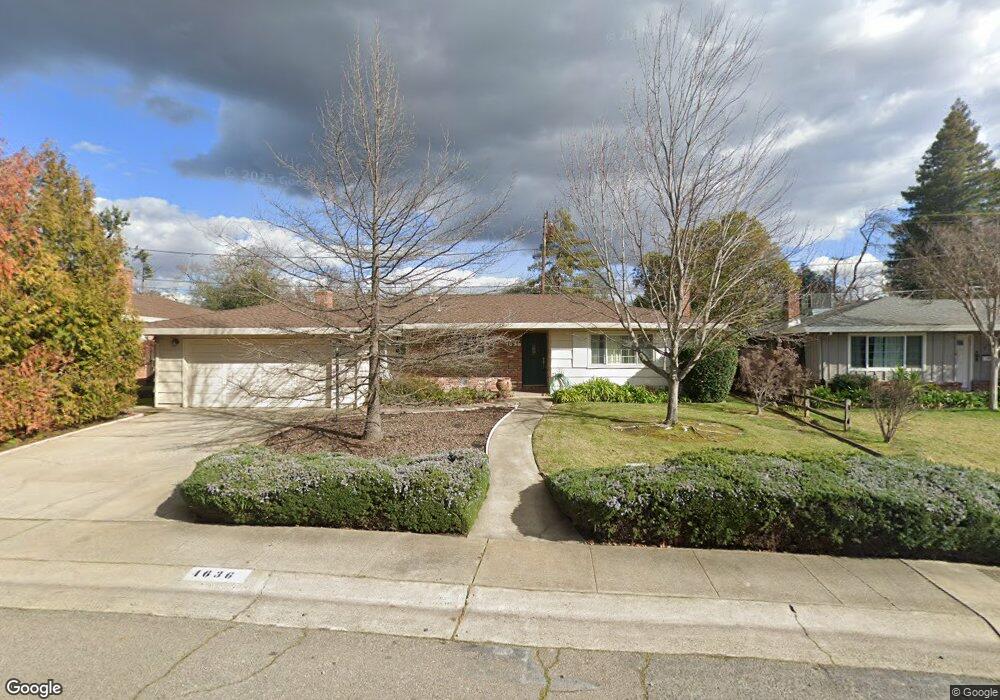
4636 Rustic Rd Carmichael, CA 95608
Estimated Value: $562,000 - $644,000
4
Beds
2
Baths
1,841
Sq Ft
$322/Sq Ft
Est. Value
About This Home
This home is located at 4636 Rustic Rd, Carmichael, CA 95608 and is currently estimated at $593,505, approximately $322 per square foot. 4636 Rustic Rd is a home located in Sacramento County with nearby schools including Albert Schweitzer Elementary School, John Barrett Middle School, and Del Campo High School.
Ownership History
Date
Name
Owned For
Owner Type
Purchase Details
Closed on
Dec 8, 2000
Sold by
Leal Esther M
Bought by
Leal Esther M and Esther M Leal Trust
Current Estimated Value
Purchase Details
Closed on
Jun 5, 1997
Sold by
Muncy Family Revocable Living Trust and Lyford C
Bought by
Leal Esther M
Purchase Details
Closed on
Mar 19, 1996
Sold by
Muncy Lyford C and Muncy Evelyn Sue
Bought by
Muncy Lyford C and Muncy Evelyn Sue
Home Financials for this Owner
Home Financials are based on the most recent Mortgage that was taken out on this home.
Original Mortgage
$87,000
Interest Rate
7.01%
Mortgage Type
Balloon
Purchase Details
Closed on
Mar 9, 1996
Sold by
Muncy Lyford C and Muncy Evelyn Sue
Bought by
Muncy Lyford C and Muncy Evelyn Sue
Home Financials for this Owner
Home Financials are based on the most recent Mortgage that was taken out on this home.
Original Mortgage
$87,000
Interest Rate
7.01%
Mortgage Type
Balloon
Create a Home Valuation Report for This Property
The Home Valuation Report is an in-depth analysis detailing your home's value as well as a comparison with similar homes in the area
Home Values in the Area
Average Home Value in this Area
Purchase History
| Date | Buyer | Sale Price | Title Company |
|---|---|---|---|
| Leal Esther M | -- | -- | |
| Leal Esther M | $173,000 | Stewart Title | |
| Muncy Lyford C | -- | -- | |
| Muncy Lyford C | -- | Stewart Title |
Source: Public Records
Mortgage History
| Date | Status | Borrower | Loan Amount |
|---|---|---|---|
| Previous Owner | Muncy Lyford C | $87,000 |
Source: Public Records
Tax History
| Year | Tax Paid | Tax Assessment Tax Assessment Total Assessment is a certain percentage of the fair market value that is determined by local assessors to be the total taxable value of land and additions on the property. | Land | Improvement |
|---|---|---|---|---|
| 2025 | $3,260 | $481,200 | $164,045 | $317,155 |
| 2024 | $3,260 | $276,219 | $135,713 | $140,506 |
| 2023 | $3,206 | $270,803 | $133,052 | $137,751 |
| 2022 | $3,141 | $265,494 | $130,444 | $135,050 |
| 2021 | $3,087 | $260,289 | $127,887 | $132,402 |
| 2020 | $3,029 | $257,621 | $126,576 | $131,045 |
| 2019 | $2,966 | $252,571 | $124,095 | $128,476 |
| 2018 | $2,931 | $247,619 | $121,662 | $125,957 |
| 2017 | $2,900 | $242,765 | $119,277 | $123,488 |
| 2016 | $2,708 | $238,006 | $116,939 | $121,067 |
| 2015 | $2,705 | $234,432 | $115,183 | $119,249 |
| 2014 | $2,648 | $229,841 | $112,927 | $116,914 |
Source: Public Records
Map
Nearby Homes
- 6810 Rappahannock Way
- 4664 Ladera Way
- 4701 Pedersen Way
- 6730 Lakeview Dr
- 4434 Mapel Ln
- 6824 Will Rogers Dr
- 4243 Glenridge Dr
- 5009 Waterbury Way
- 6636 Saint James Dr
- 4204 Abraham Way
- 4970 Hillhurst Dr
- 4463 San Juan Ave
- 4310 Hussey Dr
- 4952 Oleander Dr
- 6395 Perrin Way
- 7524 Widgeon Way
- 8213 Caminata Ln
- 4072 Porton Ln
- 4076 Porton Ln
- 6319 Saint James Dr
- 4630 Rustic Rd
- 4642 Rustic Rd
- 6979 Los Olivos Way
- 6841 Rappahannock Way
- 6971 Los Olivos Way
- 0 Winding Way
- 4624 Asheville Ct
- 4620 Asheville Ct
- 6987 Los Olivos Way
- 6834 Rappahannock Way
- 6833 Rappahannock Way
- 6963 Los Olivos Way
- 6955 Los Olivos Way
- 6900 Ellsworth Cir
- 6904 Ellsworth Cir
- 6908 Ellsworth Cir
- 4616 Asheville Ct
- 4700 Dewey Orchard Ct
- 6912 Ellsworth Cir
- 6995 Los Olivos Way
Your Personal Tour Guide
Ask me questions while you tour the home.