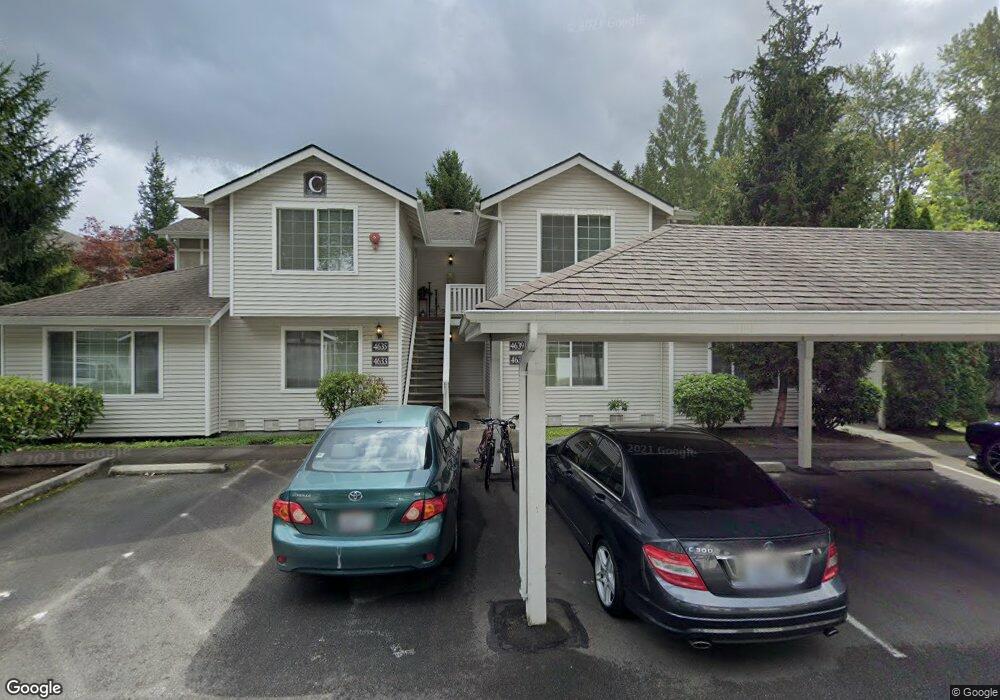
4637 168th Ct NE Redmond, WA 98052
Viewpoint NeighborhoodEstimated Value: $534,000
2
Beds
1
Bath
861
Sq Ft
$620/Sq Ft
Est. Value
About This Home
This home is located at 4637 168th Ct NE, Redmond, WA 98052 and is currently estimated at $534,000, approximately $620 per square foot. 4637 168th Ct NE is a home located in King County with nearby schools including John J. Audubon Elementary School, Rose Hill Middle School, and Lake Washington High School.
Ownership History
Date
Name
Owned For
Owner Type
Purchase Details
Closed on
Jun 9, 2003
Sold by
Suriana Petty and Chou Paul Wei Nien
Bought by
Qureshi Robina Z
Current Estimated Value
Home Financials for this Owner
Home Financials are based on the most recent Mortgage that was taken out on this home.
Original Mortgage
$133,600
Outstanding Balance
$53,066
Interest Rate
4.5%
Estimated Equity
$480,934
Purchase Details
Closed on
Aug 23, 1999
Sold by
Erickson Christine A
Bought by
Suriana Petty
Home Financials for this Owner
Home Financials are based on the most recent Mortgage that was taken out on this home.
Original Mortgage
$101,300
Interest Rate
7.75%
Purchase Details
Closed on
Dec 9, 1998
Sold by
Marymoor 33 Ltd Partnership
Bought by
Erickson Christine A
Home Financials for this Owner
Home Financials are based on the most recent Mortgage that was taken out on this home.
Original Mortgage
$107,900
Interest Rate
6.78%
Create a Home Valuation Report for This Property
The Home Valuation Report is an in-depth analysis detailing your home's value as well as a comparison with similar homes in the area
Home Values in the Area
Average Home Value in this Area
Purchase History
| Date | Buyer | Sale Price | Title Company |
|---|---|---|---|
| Qureshi Robina Z | $167,000 | Chicago Title | |
| Suriana Petty | $135,120 | Chicago Title Insurance Co | |
| Erickson Christine A | $126,950 | Chicago Title Insurance |
Source: Public Records
Mortgage History
| Date | Status | Borrower | Loan Amount |
|---|---|---|---|
| Open | Qureshi Robina Z | $133,600 | |
| Previous Owner | Suriana Petty | $101,300 | |
| Previous Owner | Erickson Christine A | $107,900 | |
| Closed | Qureshi Robina Z | $25,050 |
Source: Public Records
Tax History Compared to Growth
Tax History
| Year | Tax Paid | Tax Assessment Tax Assessment Total Assessment is a certain percentage of the fair market value that is determined by local assessors to be the total taxable value of land and additions on the property. | Land | Improvement |
|---|---|---|---|---|
| 2024 | $4,602 | -- | -- | -- |
| 2023 | $2,646 | $555,000 | $90,300 | $464,700 |
| 2022 | $2,799 | $358,000 | $75,200 | $282,800 |
| 2021 | $2,739 | $324,000 | $75,200 | $248,800 |
| 2020 | $2,416 | $293,000 | $75,200 | $217,800 |
| 2018 | $2,476 | $290,000 | $60,200 | $229,800 |
| 2017 | $2,287 | $247,000 | $36,800 | $210,200 |
| 2016 | $1,864 | $238,000 | $30,100 | $207,900 |
| 2015 | -- | $192,000 | $24,400 | $167,600 |
| 2014 | -- | $177,000 | $24,400 | $152,600 |
| 2013 | -- | $177,000 | $24,400 | $152,600 |
Source: Public Records
Map
Nearby Homes
- 4728 165th Place NE
- 17203 NE 45th St Unit 43
- 17407 NE 45th St Unit 159
- 16409 NE 43rd Ct
- 16633 NE 40th Ct
- 17315 NE 45th St Unit 148
- 4916 162nd Ct NE
- 17102 NE 37th Place
- 17442 NE 40th Place Unit D3
- 17514 NE 40th Place Unit J-3
- 17411 NE 39th Ct
- 3831 W Lake Sammamish Pkwy NE
- 4107 159th Ave NE Unit 22C
- 3834 175th Ave NE Unit 209
- 3834 175th Ave NE Unit G16
- 3834 175th Ave NE Unit E49
- 3834 175th Ave NE Unit 202
- 17517 NE 38th Ct
- 5044 157th Ct NE
- 5403 157th Dr NE
- 4635 168th Ct NE Unit C-4635
- 4639 168 Ct NE
- 4629 168th Ct NE
- 4627 168 Ct NE Unit 4627
- 4634 168th Ct NE
- 4630 168th Ct NE
- 4632 168th Ct NE Unit B-4632
- 4625 168 Ct NE
- 4628 168th Ct NE
- 4640 168th Ct NE
- 4600 E Lake Sammamish Pkwy NE Unit 4624
- 4600 E Lake Sammamish Pkwy NE Unit 4626
- 4600 E Lake Sammamish Pkwy NE Unit 4629
- 4600 E Lake Sammamish Pkwy NE Unit 4616
- 4600 E Lake Sammamish Pkwy NE Unit 4634
- 4600 E Lake Sammamish Pkwy NE Unit 4612
- 4600 E Lake Sammamish Pkwy NE Unit 4610
- 4600 E Lake Sammamish Pkwy NE Unit 4618
- 4600 E Lake Sammamish Pkwy NE Unit 4614
- 4600 E Lake Sammamish Pkwy NE Unit 4631